
Figure 1. Scatter plots of multicolor flow cytometry (FBC) and mass cytometry (MC).
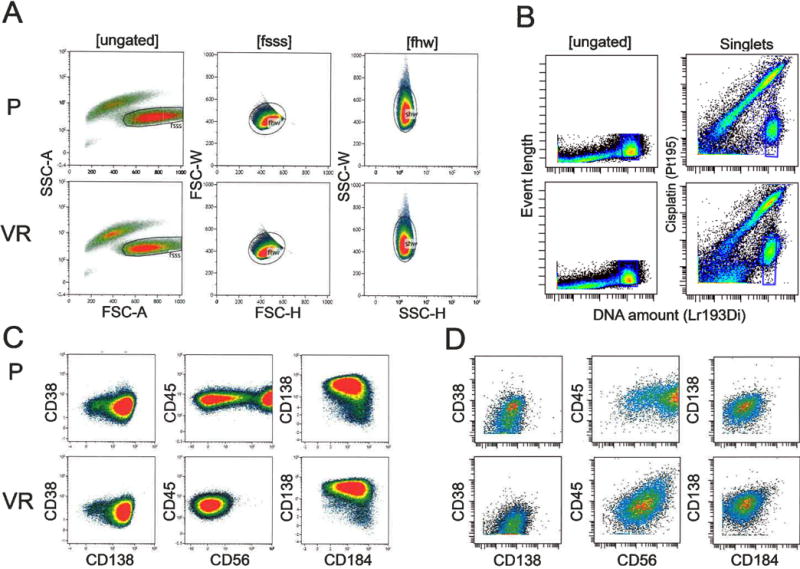
Panels A and C depict FBC, and panes B and D depict MC. In alternating rows we compared parental (P) with bortezomib/Velcade resistant (VR) cell lines. A) By FBC, both the P and VR cell lines have similar scatter characteristics. Viable cells are included by Boolean gating based on increased forward scatter (FSC) and low side scatter (SSC). Doublet discrimination is sequentially performed by including singlets based on FSC and SSC height (H) versus width (W) plots. B) In MC, live singlets are identified by DNA content (based on iridium intercalation, Ir193/195), and live cells are identified by cisplatin (PT195) exclusion. C–D) Cell surface staining characteristics of multiple myeloma markers by C) FBC and D) MC.