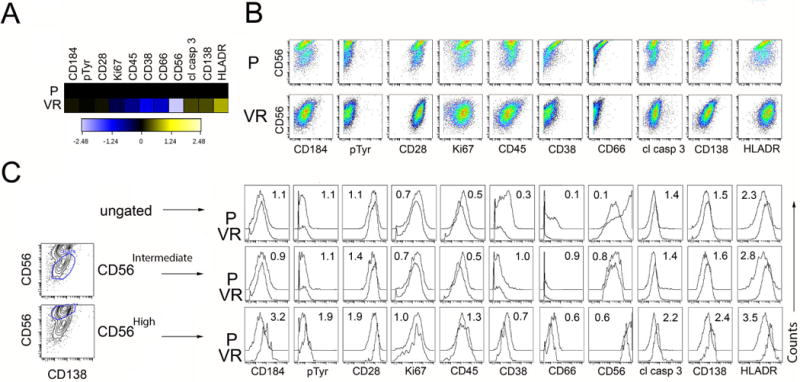
Figure 2. MC analysis reveals multidimensional corrections of cell surface markers that differ between parental and Bz resistant cells.

Cell lines were stained with cell surface markers, intracellular signaling intermediates, and functional markers (including phosphor-specific antibodies) and analyzed by MC. The fold change in the expression levels between parental and Bz resistant populations of the tested antibodies was calculated from the signal intensity and plotted as a heatmap (Figure 2A) and scatter plots (Figure 2B). We gated on both the CD56hi and CD56lo (Figure 2C) populations in the parental and Bz resistant cells and asked whether particular markers associate with CD56 surface expression; each marker depicted in individual histograms (Figure 2C).
