
Figure 4. viSNE analysis identifies a subpopulation of Bz resistant cells with correlates to a subpopulation in parental cells.
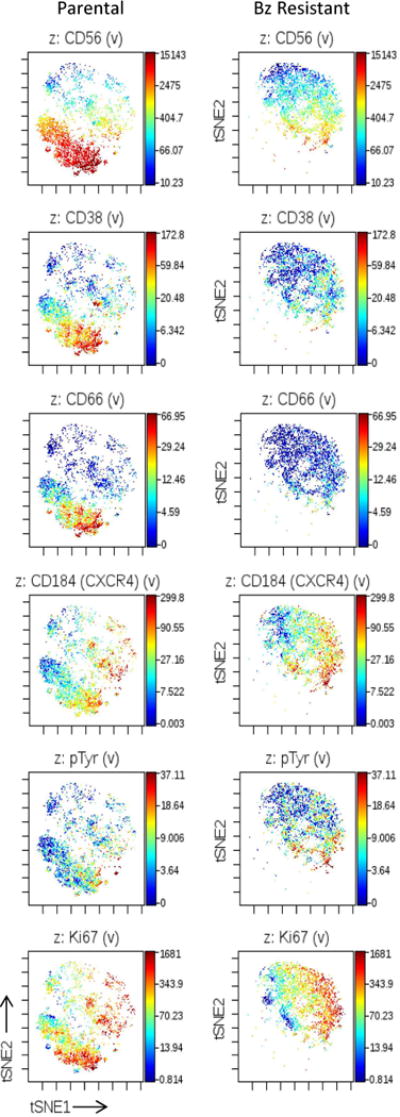
Parental and Bz-resistant multiple myeloma cells were stained with a panel of 14 cell surface antibodies and 4 functional epitopes and measured by mass cytometry. viSNE analysis was performed on these data by using all epitopes that were measured. The same number of cells from each group were sampled for creation of the viSNE plot. Rainbow color scale reflects expression values (arcsinh difference) of each epitope. Each dot represents a single measured cell. The labels at the top of each plot indicate the epitope that is displayed.