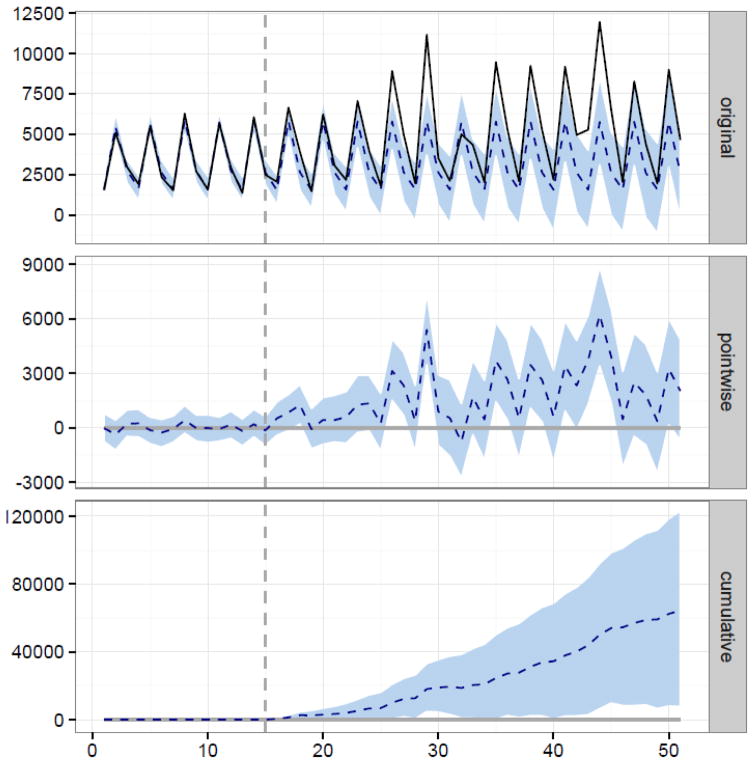
Figure 1.
Causal Effect of Opening the High Line on Pedestrian Counts on 14th Street between 8th Avenue and Hudson Street, New York City. Panel a) shows the time series of available counts, including the structural time series model predictions in the absence of opening the high line. Panel b) shows the difference between estimated and observed pedestrian counts on 14th street. Panel c) shows the estimated cumulative impact of opening the High Line. On all panels, the vertical line indicates the time at which the High Line was opened.

