
Figure 6.
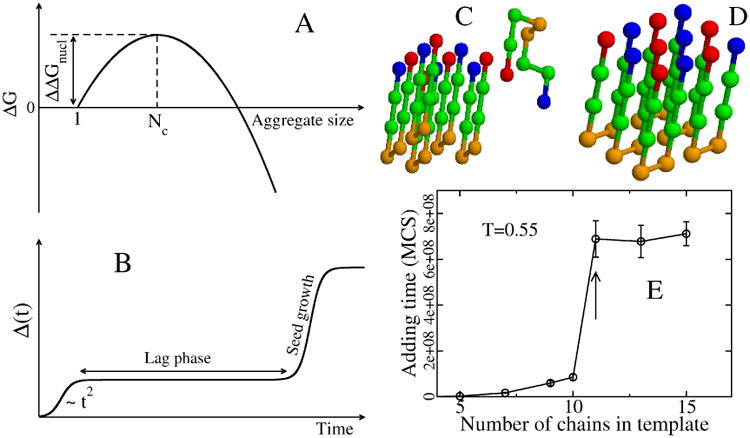
(A) Schematic plot of free energy of the aggregate, relative to the monomer, as a function of the aggregate size. The critical nucleus size corresponds to the peak of ΔG, while ΔΔGnucl is the barrier to nucleation. (B) Time dependence of the fibril mass M(t). Within homogeneous nucleation theory M(t) ∼ t2 at short time scales. The plateau corresponds to the lag phase, whose duration is proportional to exp(ΔΔGnucl/kBT). (C) A typical initial conformation for the (5+1) system in the lattice models with 8-bead sequence +HHPPHH-, where + and − refer to charged residues, while H and P denote hydrophobic and polar residues.(229) (D) The final fibril conformation with the lowest energy. (E) Dependence of the adding time τadd on the number of monomers that belong to the preformed template. Results are averaged over 50 Monte Carlo trajectories. At a concentration of 290 μM, τadd becomes independent of N for Ntemplate larger than 11. Arrow refers to Nc=11.(230)