
Fig. 4.
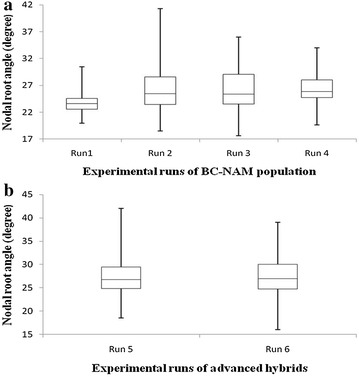
Box and whisker plots of nodal root angle of sorghum in the phenotyping platform for a a BC-NAM population screened across four runs and b advanced hybrids screened across two runs. For each run, the bottom and top of the box represent the first and third quartile values, the band inside the box represents the median value, and the ends of the whiskers represent the minimum and maximum values