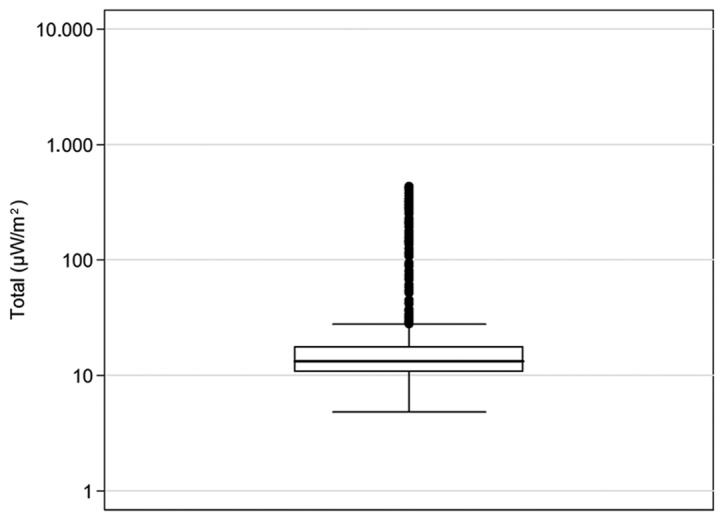
Figure 1.

World Health Organization, 20 Avenue Appia, CH-1211 Geneva 27, Switzerland. Box plot for total exposure in µW/m2, logarithmic scale. The median is indicated by a black line inside the box; the bottom and top of the boxes show first and third quartiles; the end of the whisker is calculated as 1.5×IQR (interquartile range). Points represent outliers.
