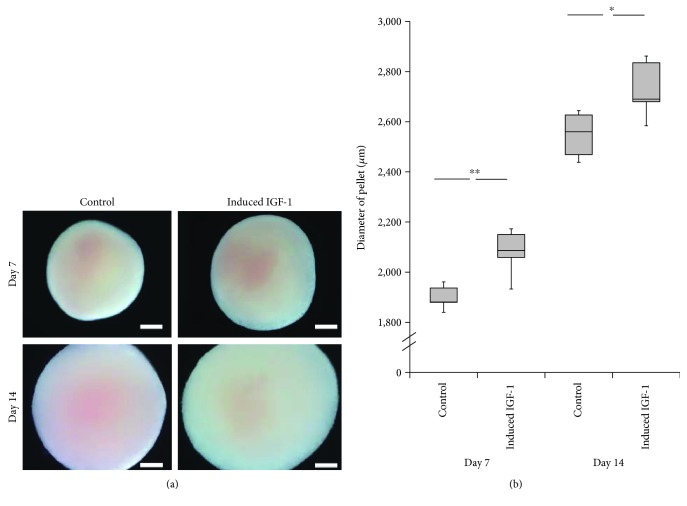
Figure 1.
Diameters of the pellet cultures after 7 and 14 days of chondrogenic differentiation. (a) Microscopic findings: control (left) versus IGF-1 gene transferred cell-derived pellets (right). Showing results after 7 days (upper) and 14 days (lower). Scale bars = 500 μm. (b) Graph showing the diameter of the pellet cultures after 7 and 14 days. Vertical axis: diameters (μm); horizontal axis: the control (left) versus induced IGF-1 (right). Statistical analysis using independent samples t-test, ∗∗p < 0.01, ∗p < 0.05.

