
Figure 1.
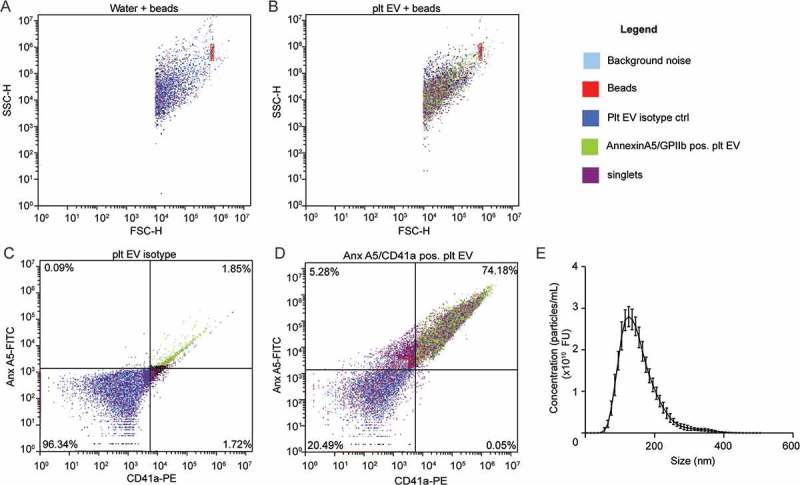
Characterisation and quantification of platelet EVs. SSC-H over FSC-H colour dot plots: water and 200 beads/µl were recorded. Background noise (light blue) and bead gate (red) was set (a). Platelet EV suspensions without or with CaCl2 were recorded with a limit set on bead gate (b). Colour dot plots of platelet EV isotype control (blue) (c) and annexin A5/CD41a positive platelet EVs (green) (d). Size distribution of platelet EV suspensions measured by advanced nanoparticle tracking analysis (n = 10) (e).