
Figure 2.
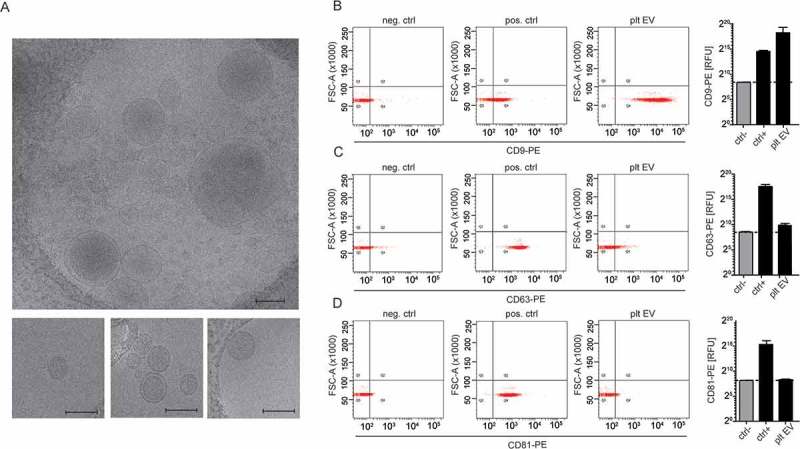
Cryo-transmission electron microscopy and bead coupled flow cytometry of platelet EVs. Representative micrographs from cryo-TEM of platelet EV suspensions. Scale bar 200 nm (a). Representative scatterplots and quantification of bead coupled flow cytometry for CD9 (b), CD63 (c) and CD81 (d) (n = 3).