
Figure 4.
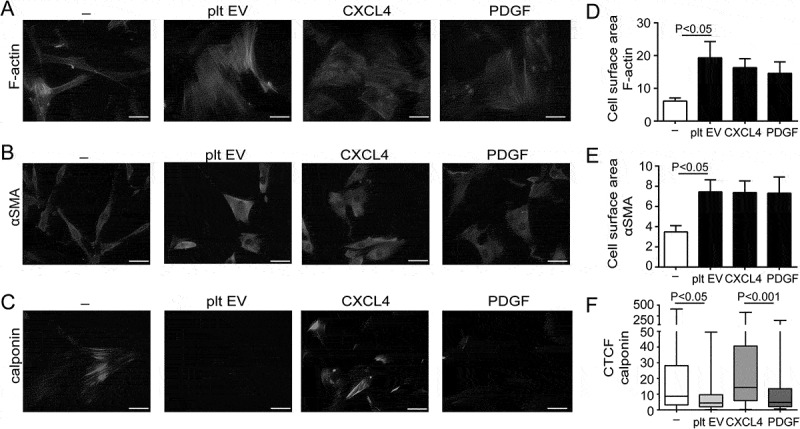
Platelet EVs change SMC morphology. Micrographs of SMC stained with antibodies against F-actin (a), αSMA (b) or calponin (c) after control, platelet EV-, PDGF- or CXCL4-stimulation for 96 h. Nuclei were stained with DAPI. Scale bars: 50 µm. Cell surface area (µm2) (d,e) and corrected total cell fluorescence (CTCF) (f) were quantified and displayed as bar graphs or box-and-whiskers plots, respectively. p-values were calculated by ANOVA with Tukey’s (d,e) or Kruskal–Wallis (f) post-tests (n = 3).