
Figure 1.
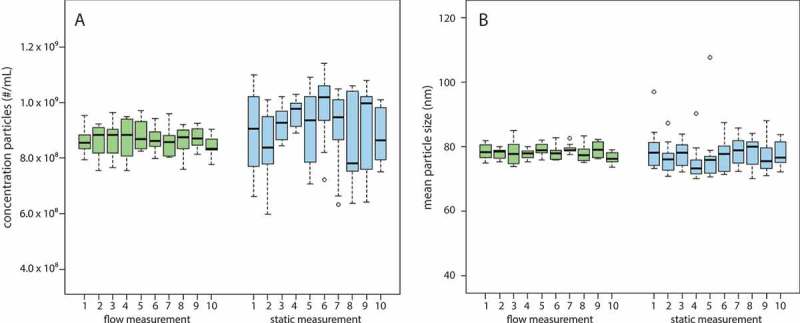
Static (blue) and flow (green) measurements of outer membrane vesicles. Boxplot A shows the result of NTA particle concentration measurement and plot B of NTA particle sizing. Boxes represent 10 measurements of 60 s. Outliers represent measurements 1.5 times the interquartile range below the lower quartile or above the upper quartile.