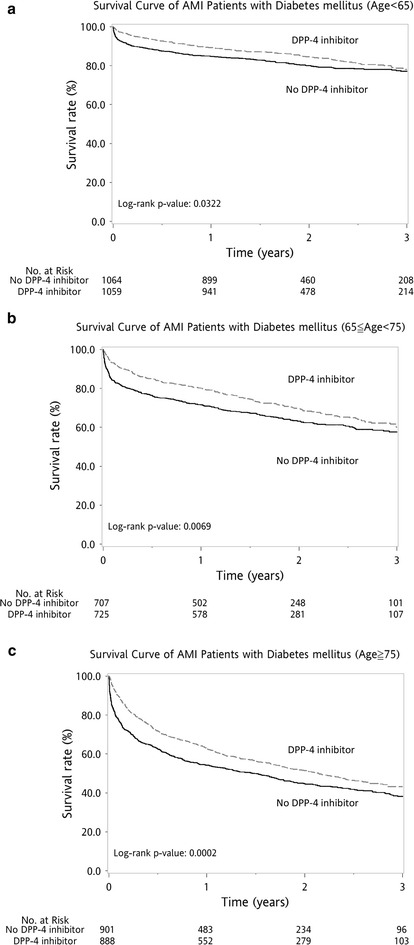
Fig. 3.

Kaplan–Meier survival curve after first acute myocardial infarction (AMI) for age subgroup analysis. Patients in the DPP-4i and control groups were subdivided into three subgroups by age. Kaplan–Meier cumulative survival curves revealed better survival in all three subgroups [age <65 years (log-rank P = 0.0322, a), 65 ≤ age < 75 years (log-rank P = 0.0069, b), and age ≥75 (log-rank P = 0.0002, c)]
