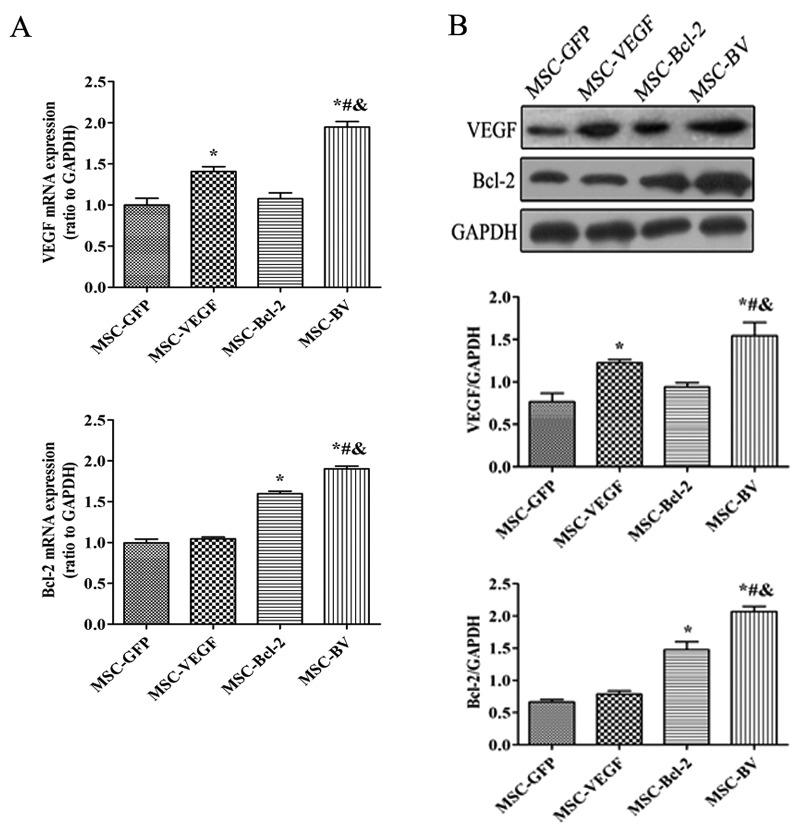
Figure 2.
Target gene expression. (A) RT-qPCR detected the mRNA expression levels of the target genes. (B) A representative western blot and quantitative analysis of the vascular endothelial growth factor (VEGF), Bcl-2 and glyceraldehyde 3-phosphate dehydrogenase (GAPDH) levels. *P<0.05 compared to mesenchymal stem cell (MSC)-green fluorescent protein (GFP) ; #P<0.05 compared to MSC-VEGF group; &P<0.05 compared to MSC-Bcl-2 group. Each of the experiments was repeated 5 times, n=5.

