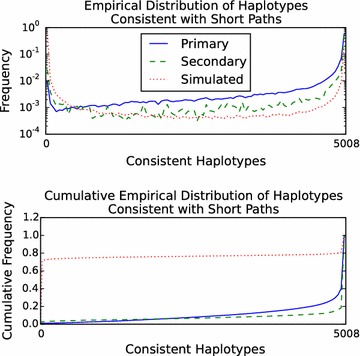
Fig. 3.

Distribution (top) and cumulative distribution (bottom) of the number of 1000 Genomes Phase 3 haplotypes consistent with short paths in the GRCh37 chromosome 22 graph. Primary mappings of 101 bp reads with scores of 90 out of 101 or above () are the solid blue line. Secondary mappings meeting the same score criteria () are the dashed green line. Simulated 100 bp random walks in the graph without consecutive N characters () are the dotted red line. Consistent haplotypes were counted using the gPBWT support added to vg [18].
