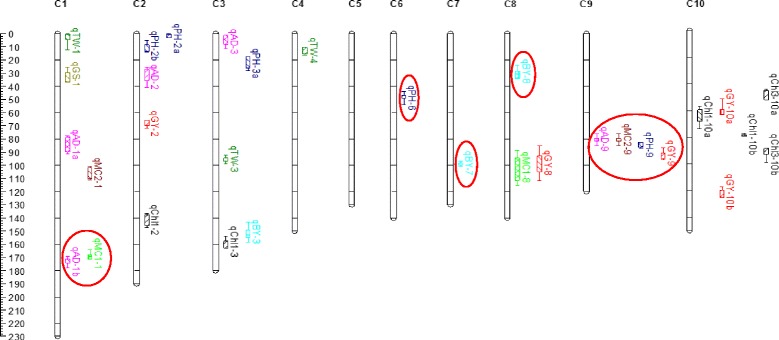
Fig. 1.

QTL locations for 11 agronomic traits studied in the Ck60/San Chi San RIL population. QTLs were represented in different colors for 11 agronomic traits including black for Chl-1, Chl-2, and Chl-3 (chlorophyll contents at vegetative, at anthesis and at maturity stages), blue for PH (plant height, cm), pink for AD (anthesis date, days), lawn green for MC1 (stover moisture content, %), brown for MC2 (head moisture content, %), light blue for BY (biomass yield, t.ha−1), red for GY (grain yield, t.ha−1), dark green for TW (thousand grain weight, g) and tan for GS (grain to stover ratio, %) on chromosomes C1 to C10. QTLs detected stably across environments are presented by open bars and with different fills for 11LN, 11NN, 12LN and 12NN, comb-NN and comb-LN conditions. Supported intervals for each QTL are indicated by the length of vertical bars. The nine QTLs circled in red were detected in this study and also in our earlier study; these validated QTLs were stable across both mapping populations
