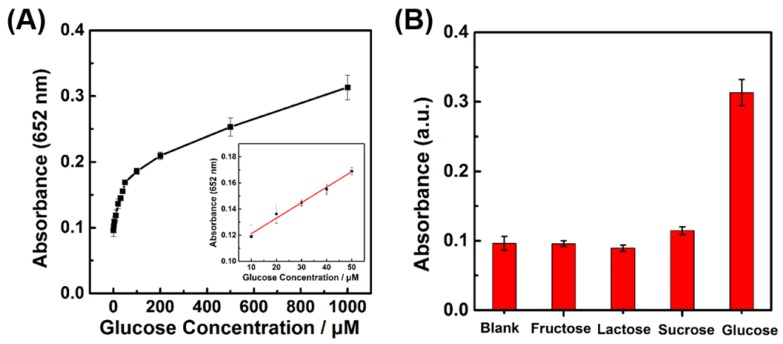
Figure 6.
(A) Dependence of A652 for monitoring the catalytic oxidation of TMB on the concentration of glucose from 2 μM to 1 mM. The inset shows the linear calibration plot between the concentration of glucose and the absorbance at 652 nm. (B) Selectivity of glucose detection with the porous LaNiO3 nanocubes. Absorbance of TMB at 652 nm in the absence and presence of 5 mM fructose, 5mM lactose, 5 mM sucrose, and 1 mM glucose.

