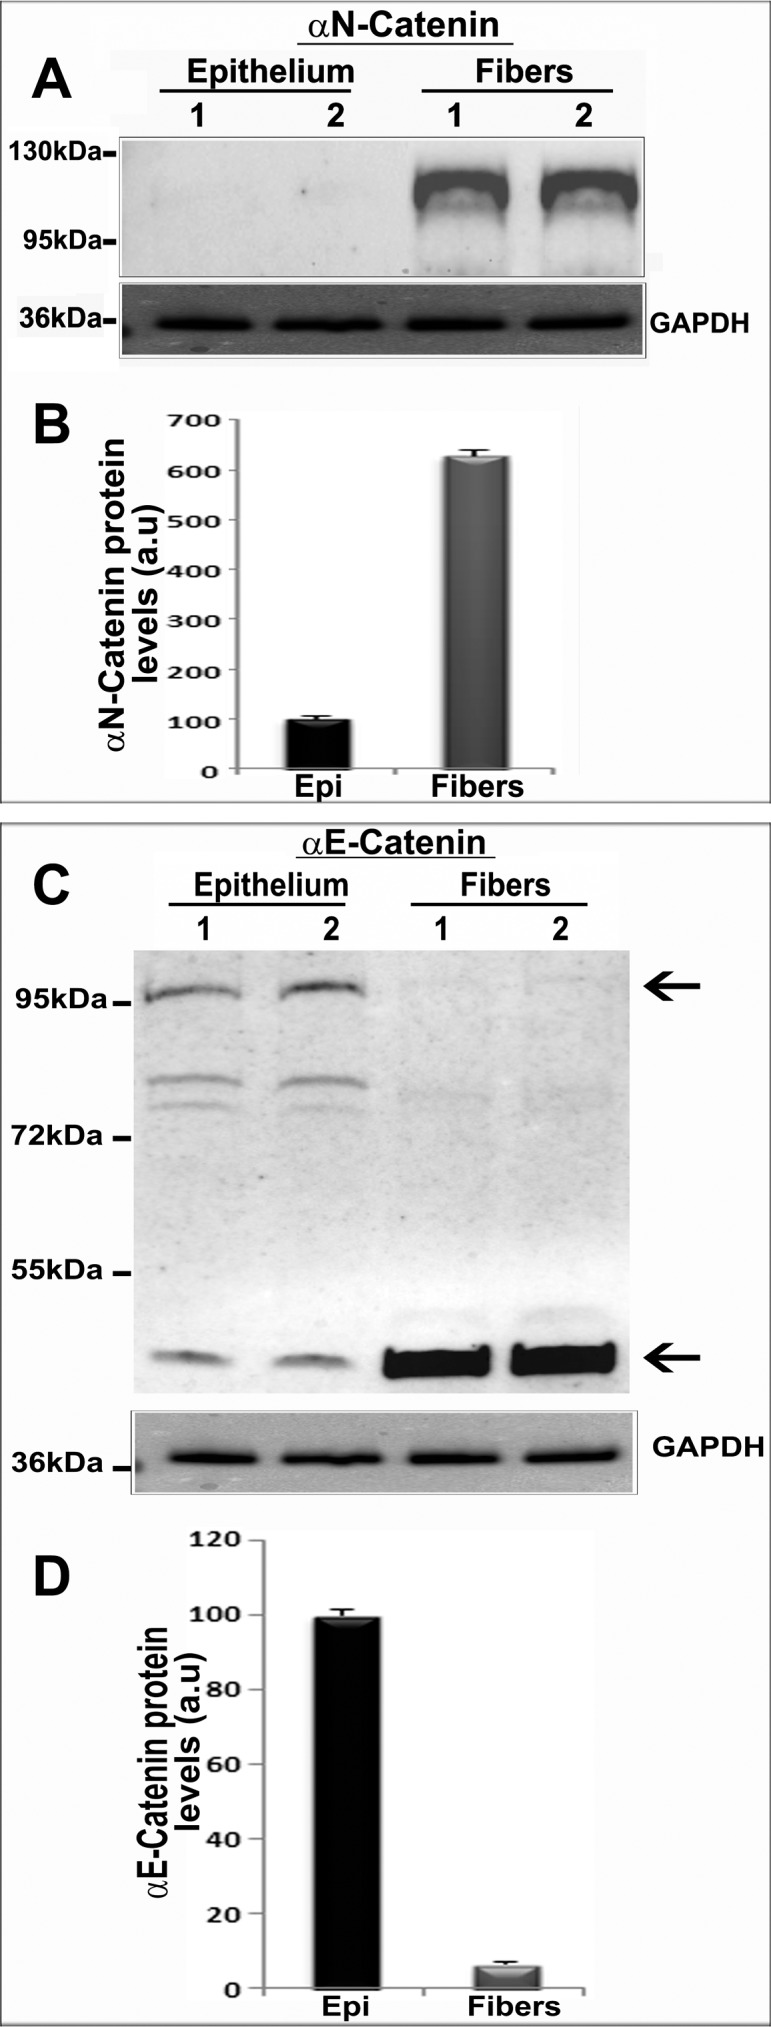
Figure 3.

Distribution of αN-catenin and αE-catenin in the epithelial and fiber mass fractions of mouse lens. (A) Distribution of αN-catenin in the epithelial and fiber mass fractions (800g supernatant) of two independent (lanes 1 and 2) P21 mouse lens samples. (B) Quantitative changes in αN-catenin protein levels between epithelial and fiber mass fractions of mouse lens. (C) Distribution of αE-catenin in the lens epithelium and fiber mass by immunoblot analysis using the respective tissue homogenates derived from P21 mouse lens described in A. The upper arrow points to the expected native form of αE-catenin. The lower arrow indicates the nonspecific immunoreactivity to the αE-catenin antibody used. Lanes 1 and 2 represents two independent samples. (D) Quantitative differences in the levels of αE-catenin between the lens epithelium and fiber mass based on densitometric analysis of immunoblots shown in C. GAPDH was probed as a loading control. Values are mean ± SD based on two pooled samples. a.u., arbitrary units.
