Fig. 1.

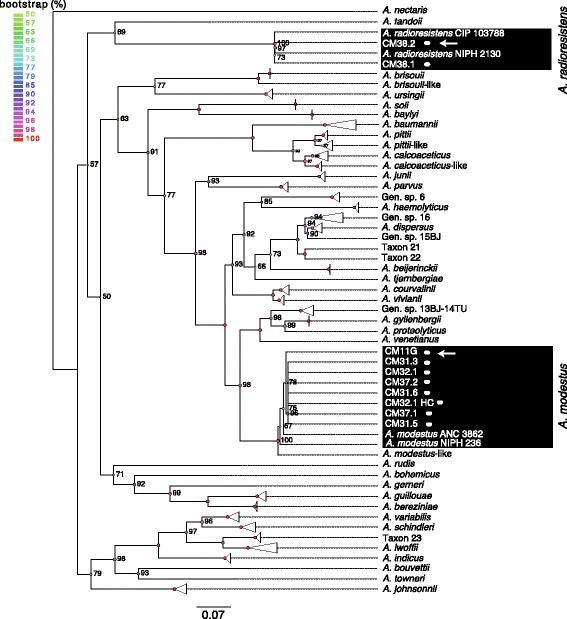
Phylogenetic tree of Acinetobacter strains based on recA gene sequences. Triangles mark groups of taxa that are from the same species. The scale bar represents the average number of substitutions per site

Phylogenetic tree of Acinetobacter strains based on recA gene sequences. Triangles mark groups of taxa that are from the same species. The scale bar represents the average number of substitutions per site