Fig 1.
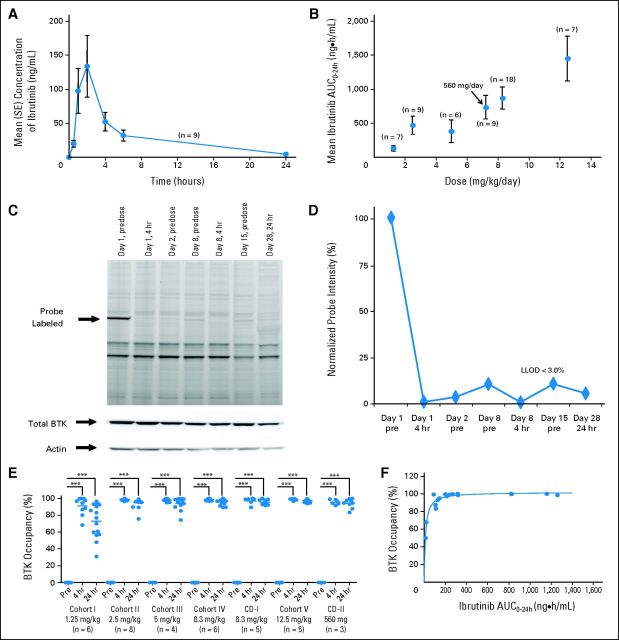
Pharmacokinetic and pharmacodynamic studies of ibrutinib. (A) Mean plasma concentration of ibrutinib over time at the 560-mg per day dose and (B) relationship between plasma area under the concentration-time curve (AUC) and dose are shown. Error bars represent SEM; arrow indicates the 560-mg fixed dose, which corresponded to a mean dose of 7.22 mg/kg per day (range, 5.6 to 9.3 mg/kg per day) based on actual patient body weight. (C) Representative probe assay data from peripheral blood mononuclear cell (PBMC) samples collected from patient with chronic lymphocytic leukemia from dose-level cohort IV (8.3 mg/kg per day). The probe (fluorescently tagged derivative of ibrutinib) binds to Bruton tyrosine kinase (BTK; indicated by arrow) with remarkably little specific labeling of other proteins. Total BTK and actin protein levels in each sample are shown to normalize protein in each lane. The BTK-bound fluorescent probe is unable to bind BTK in the samples obtained after drug administration because of occupancy of the binding site by ibrutinib. (D) Normalized intensity of probe labeling is plotted, and the lower limit of detection (LLOD) for this gel is indicated. (E) Comparison of the degree of BTK occupancy by ibrutinib at each dose-level cohort in the study. Dots represent a single BTK occupancy measurement using the probe assay; line indicates median percentage occupancy; asterisks denote P < .001 (analysis of variance). These data suggest that full BTK occupancy was generally achieved in patients at doses ≥ 2.5 mg/kg. (F) Pharmacokinetic and pharmacodynamic relationship of BTK active-site occupancy and ibrutinib exposure. Samples of PBMCs were collected predose and at 4 and 24 hours after administration of ibrutinib for each patient. Data represent the percentage of BTK occupancy before dosing and averaged between 4 and 24 hours postdose for each patient in each group. These values are plotted against the drug exposure (AUC0-24) achieved in the patient after administration of ibrutinib on day 1. Line represents the line of best fit of a simple maximum-effect model to the data. Analysis of pharmacokinetic and pharmacodynamic profiles on day 1 showed that BTK active-site occupancy was saturated or near saturated (> 95%) at AUC values ≥ 160 ng × h/mL.

