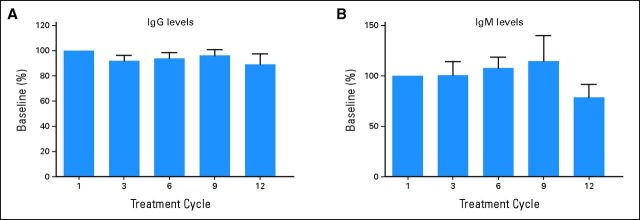
Fig A1.
Serum immunoglobulin (Ig) levels of patients treated with ibrutinib over 12 cycles. Total (A) IgG and (B) IgM levels from cycles one (predose; n = 54), three (n = 18), six (n = 28), nine (n = 10), and 12 (n = 7) were determined for patients and converted to percentage by using the predose level as 100%; shown as mean plus SEM in each bar graph.

