
Figure 2.
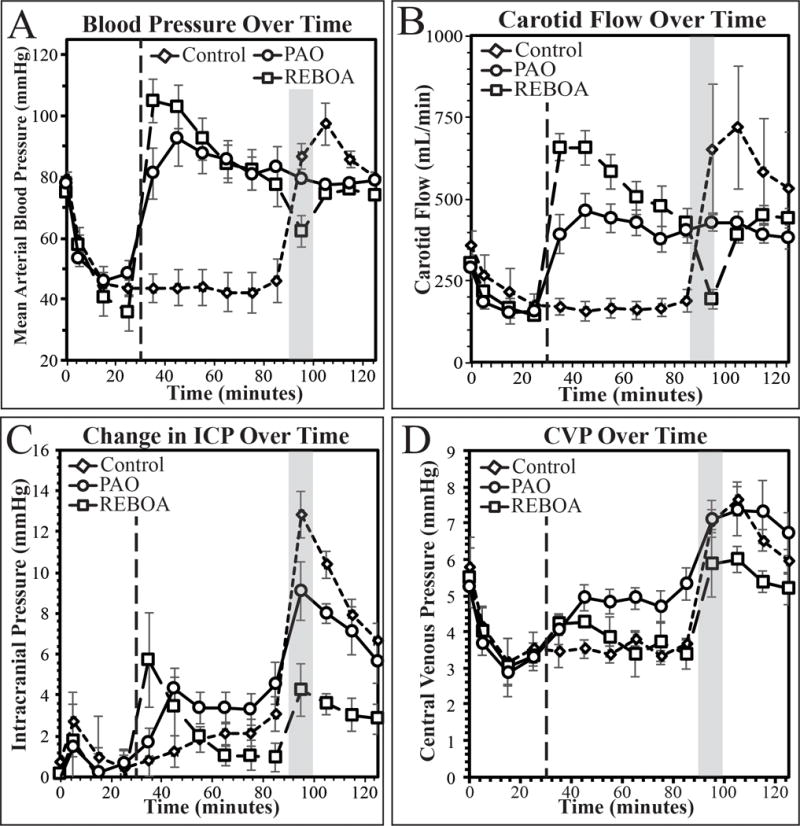
Mean arterial pressure (A), carotid blood flow (B), change in intracranial pressure (C), and central venous pressure (D) during the first 120 minutes of the experiment. Dashed line demarks beginning of intervention, shaded box demarks whole blood resuscitation.