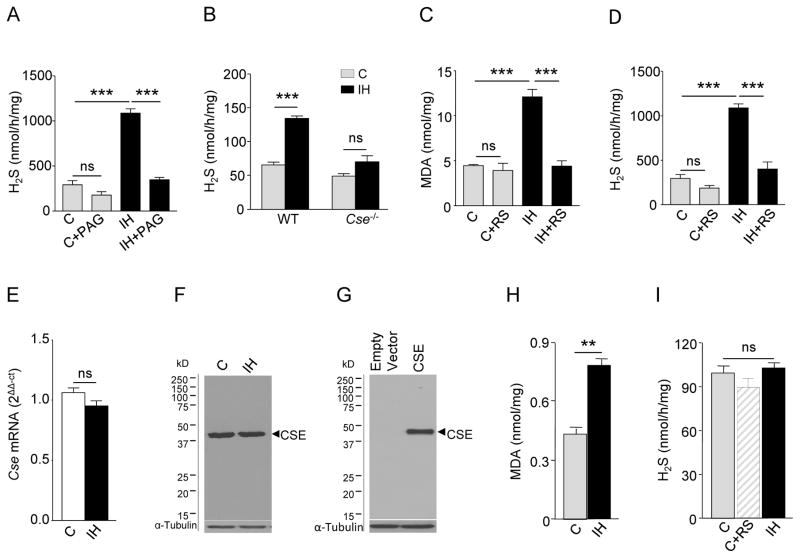
Fig. 1. Induction of CSE-dependent H2S production by intermittent hypoxia (IH).
(A) H2S concentrations in the carotid bodies of rats exposed to room air (C), room air with L-PAG (C+PAG), IH, or IH with L-PAG (IH+PAG) (n = 3 experiments for each treatment; a total of 12 carotid bodies from 6 rats for each treatment). (B) H2S concentrations in wild-type (WT) and CSE null (Cse−/−) mice exposed to room air (C) or IH (n =3 experiments for each treatment per genotype; a total of 24 carotid bodies from 12 mice for each treatment per genotype). (C to D) Malondialdehyde (MDA; C) and H2S amounts (D) in the carotid bodies of rats exposed to room air (C), room air with MnTMPyP, a ROS scavenger (RS; C+RS), IH or IH with RS (IH+ RS) (n = 3 experiments for each treatment; a total of 12 carotid bodies from 6 rats for each treatment). (E) Reverse transcription and quantitative real-time PCR (RT-qPCR) assay of Cse mRNA normalized to 18S rRNA in carotid bodies of rats exposed to either room air (C) or IH, normalized to C (n = 3 experiments for each treatment; a total of 6 carotid bodies from 3 rats for each treatment). (F) Representative immunoblot of CSE protein abundance in liver tissue of rats exposed to room air (C) or IH (n =3 experiments for each treatment). (G) Representative immunoblot of CSE expression in HEK-293 cells stably transfected with empty vector or vector encoding CSE (n=3 experiments). α-tubulin abundance was assayed in F and G as a loading control. (H) MDA and (I) H2S amounts in CSE-expressing HEK-293 cells exposed to room air (C), room air with RS or IH (n = 4 experiments for each treatment). Data are presented as means ± SEM. **p < 0.01; ***p <0.001; ns, not significant. See fig.S1 for data on concentrations of H2S and MDA and CSE protein abundance in rat liver.

