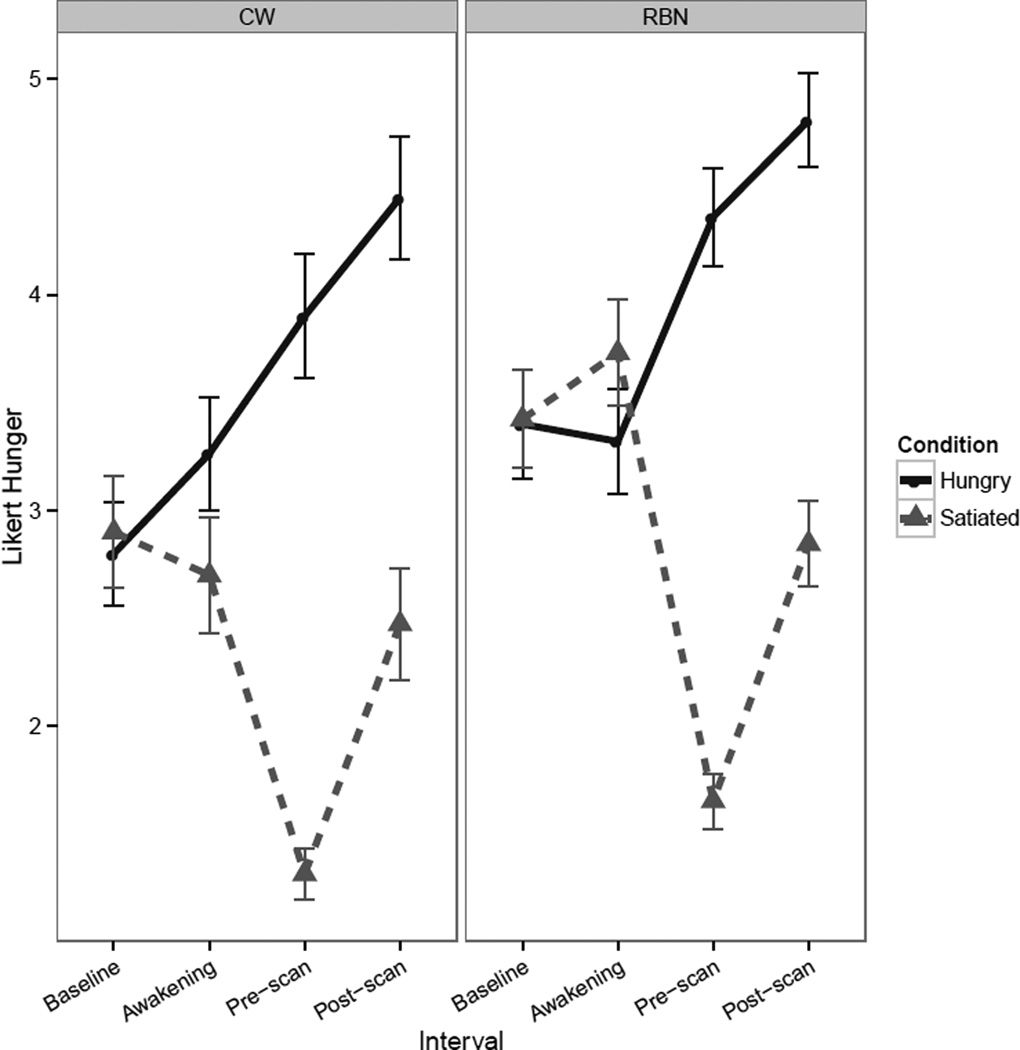
FIGURE 2.
Line graphs reflecting self-report Likert visual analog scale values. Line graph of pre- and post-scan self-report measures of hunger shows a Condition x Interval interaction [F(1,303)=11.35, p<0.001, with significant main effect of Condition [F(1,303)=458.39, p<0.001] and of interval [F(1,303)=64.97, p<0.001]. Error bars represent the standard error. CW: healthy comparison women; RBN: women remitted from bulimia nervosa.

