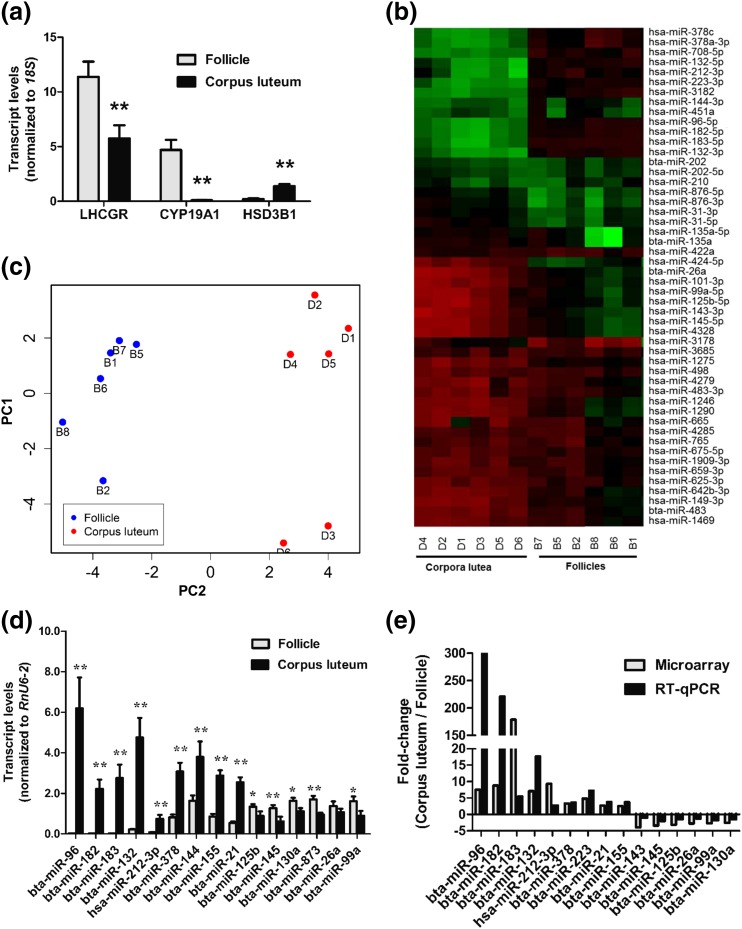
Figure 1.
(a) Relative mean [± standard error (SE)] transcript levels of LHCGR, CYP19A1, and HSD3B1 in bovine ovulatory-size follicle (12 to 17 mm; n = 6) and early CL (n = 6) samples used for microarray analyses. (b, c) Heat map representation (b) and principal component analyses (PCA) plot (c) of top 50 miRNA probes with highest standard deviation in bovine ovulatory-size follicles and early CLs. Each row in the heat map represents an miRNA and each column represents a sample. The color scale illustrates the relative expression level of miRNAs. Red represents an expression level below the reference channel and green represents expression higher than the reference. For PCA plot analysis, the normalized log ratio values were used. The features were shifted to be zero centered (i.e., the mean value across samples was shifted to 0) and scaled to have unit variance (i.e., the variance across samples was scaled to 1 before the analysis). Raw microarray data were deposited in the National Center for Biotechnology Information Gene Expression Omnibus repository (GSE54692). (d) Levels (mean ± SE), obtained by qPCR, of top transcripts identified by microarray as up- or downregulated in early CL relative to ovulatory-size follicles. (e) Comparative mean fold changes in miRNA expression between bovine early CL and ovulatory-size follicles obtained by microarray and qPCR. P values are for the differences between two means, determined by t test. *P < 0.05; **P < 0.01.

