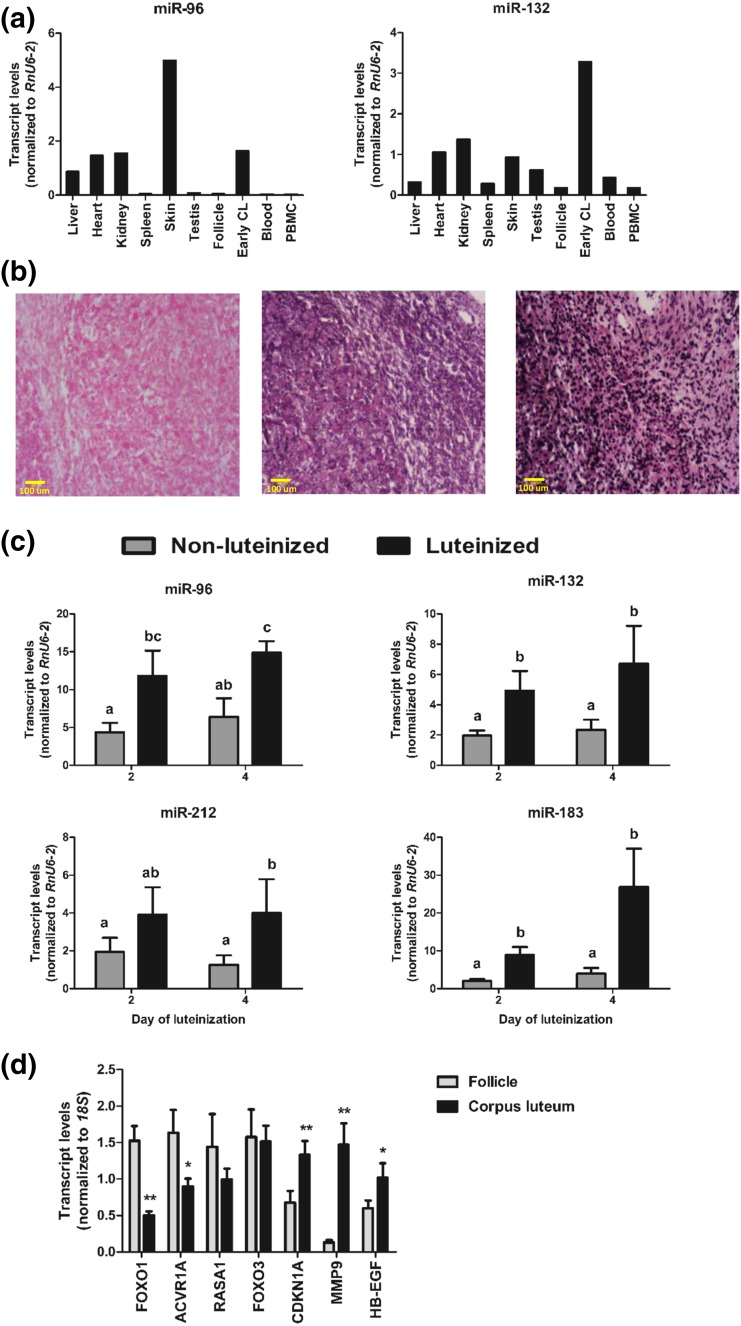
Figure 2.
(a) Relative abundance of miR-96 and miR-132 across several bovine tissues. For each tissue, RNA samples from three to five animals were pooled and analyzed by qPCR. (b) Localization of miR-132 within the bovine CL by in situ hybridization. Frozen ovarian sections were hybridized with digoxigenin-labeled LNA probe against scrambled RNA (negative control, left panel), bta-miR-132 (middle panel), and RnU6 snRNA (positive control, right panel). Scale = 100 μm; ×20 magnification. (c) Changes in relative miRNA levels (mean ± SE) during in vitro luteinization of bovine granulosa cells. Granulosa cells were cultured for 4 days with or without media containing forskolin, insulin, and FBS to induce luteinization (n = 5 experiments). Data are shown relative to expression values on day 0. Group means with different letters (a, b, c) are different (P < 0.05). (d) Relative mean (±SE) transcript levels, quantified by qPCR, of predicted common targets of miR-96 and miR-132 in bovine ovulatory-size follicles (9 to 17 mm; n = 6) and early CL (n = 6). *P < 0.05 for mean differences within each gene. PBMC, peripheral blood mononuclear cell.

