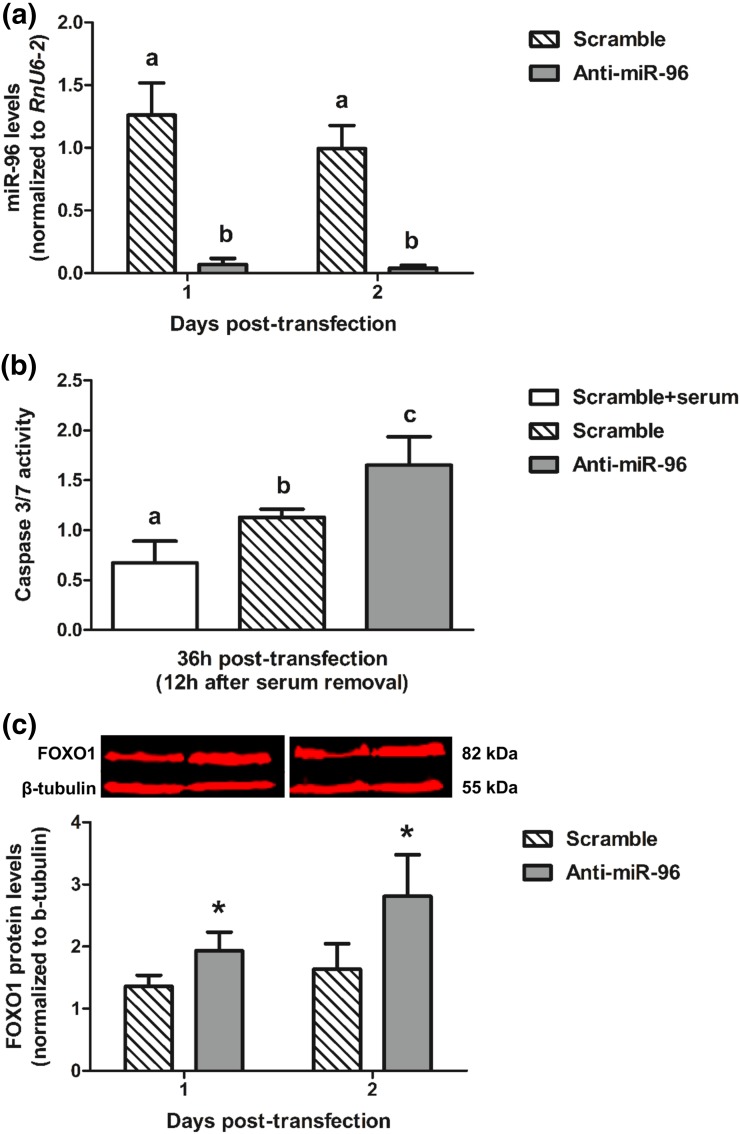
Figure 5.
Relative levels (mean ± SE) of (a) miR-96, (b) Caspase 3/7 activity, and (c) FOXO1 protein (with representative Western blot) after transfection of bovine luteal cells with scramble oligonucleotide (50 nM, negative control) or anti-miR-96 (50 nM) at the indicated times (n = 3 experiments). Values shown for each time point were normalized in all cases to the corresponding value at the time of transfection (day 0 or hour 0). For miR-96 and Caspase 3/7, significant differences (P < 0.05) between means are shown by different letters (a,b,c). Mean FOXO1 values were compared between groups within each day. *P < 0.05.

