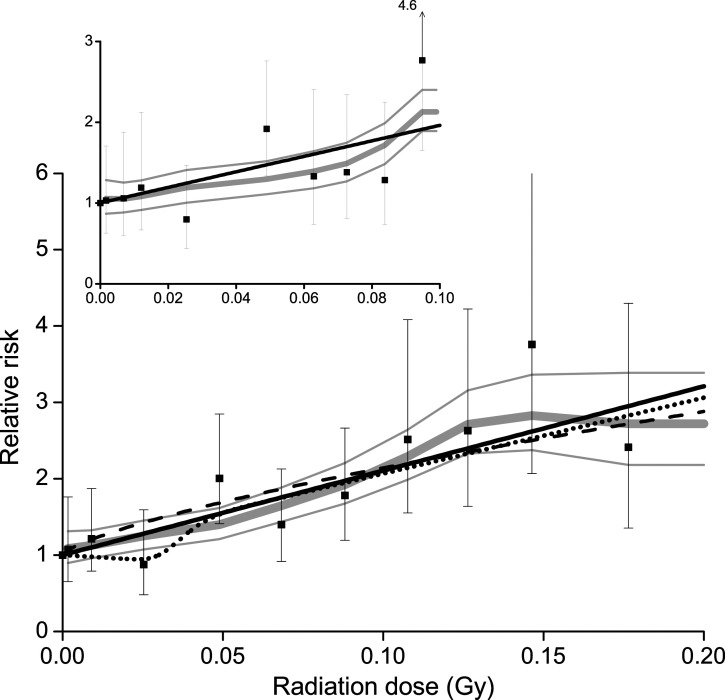
Figure 1.
Category-specific RR of thyroid cancer by thyroid radiation dose (solid symbol) with 95% CI, a moving-average smoothing (gray line) and ±1 standard deviation (thin gray line), the fitted linear ERR model (solid black line), and a restricted cubic spline (dash-dot-dot line). Data pooled from nine cohort studies and limited to <0.2 Gy (main panel) or <0.1 Gy (inset). Also, the linear-exponential-linear model (Supplemental Appendix (205.7KB, pdf) ) fitted to all data with the full range of doses (dash line).

