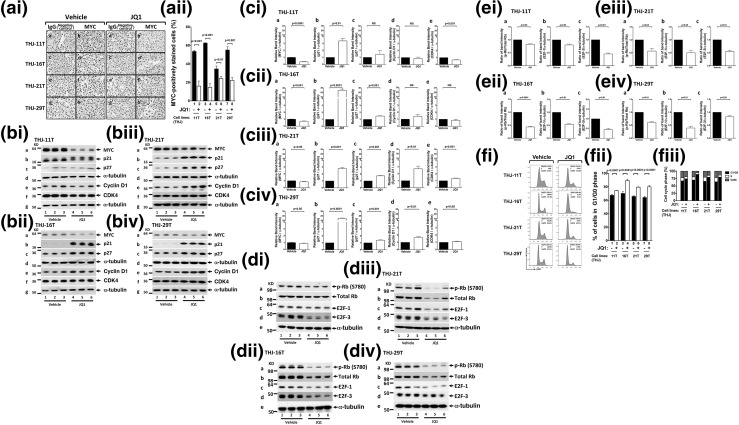
Figure 3.
JQ1 decreased MYC and elevated p21 protein abundance in human ATC cell lines. (ai) Immunohistochemical analysis for MYC protein was carried out after the THJ-11T, THJ-16T, THJ-21T, and THJ-29T cell lines were treated with vehicle or with JQ1 (500 nM) for 48 hours. (aii) Quantification of MYC-positive cells indicated reduction of MYC protein by JQ1. (bi–biv) Cell lysates were prepared from the THJ-11T, THJ-16T, THJ-21T, and THJ-29T cell lines. The blots were probed with the antibodies against MYC, p21, p27, cyclin D1, and CDK4 and the loading control α-tubulin, as described in the Materials and Methods section. (ci–civ) Band intensities in (b) were quantified, allowing a comparison between vehicle-treated and JQ1-treated cells. The P values are shown. (di–div) Cell lysates were prepared from the THJ-11T, THJ-16T, THJ-21T, and THJ-29T cell lines. The blots were probed with the antibodies against p-Rb, total Rb, E2F-1, and E2F-3 and the loading control α-tubulin, as described in the Materials and Methods section. (ei–eiv) Band intensities in (di–div) were quantified, allowing a comparison between vehicle-treated and JQ1-treated cells. The P values are shown. (fi–fiii) JQ1 inhibited cell cycle progression of ATC cell lines. (fi) Cell cycle profiles in THJ cell lines. The percentages of cell populations of different cell cycle phases are shown in the upper-right corner. After JQ1 treatments, all THJ cell lines were blocked in the G1/G0 phase, and there was reduction in the S and G2/M phases. (fii) JQ1 treatment lengthened the G1/G0 phase in ATC cells. (fiii) JQ1 treatment affected the distribution of cell cycle. Different cell cycle phases were quantified by 4′,6-diamidino-2-phenylindole staining, followed by fluorescence-activated cell sorting analysis in THJ cell lines.

