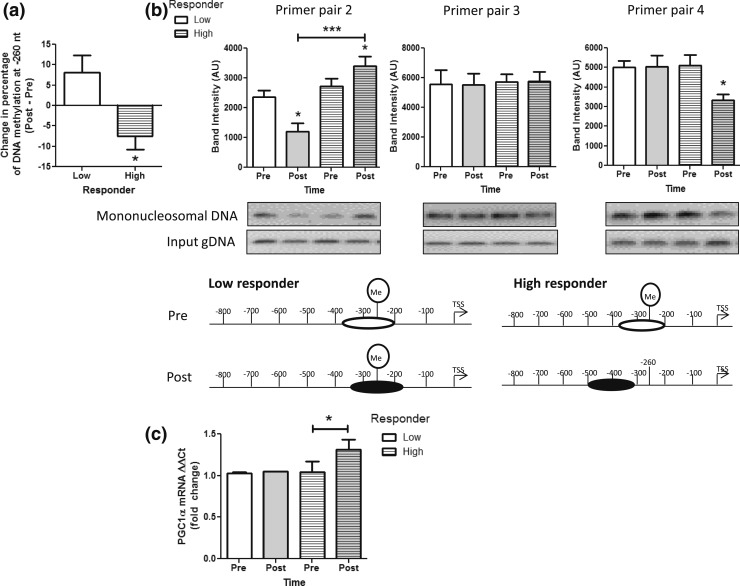
Figure 3.
High vs low DNA methylation responders. (a) The −260 nt DNA methylation levels in the PGC1α promoter were determined by pyrosequencing and the change in methylation levels from pre-exercise to post-exercise were determined. Participants in the acute exercise bout showing no change or an increase in methylation were considered low responders (clear). Participants with a decrease in PGC1α −260 nt DNA methylation were considered high responders (striped). (b) Scanning PCR was performed in the promoter region of PGC1α in low (clear) and high responders (striped bars) before (Pre; white bars) and immediately after exercise (Post; gray bars), and densitometry results are shown for primer pairs 2, 3, and 4 [see Fig. 1(a)]. Representative gel images and a schematic of approximate positions of the −1 N within the PGC1α promoter are depicted below the scanning PCR result graphs for each condition. (c) PGC1α mRNA expression was determined by qRT-PCR in skeletal muscle samples from low (clear) and high responders (striped) before (Pre; white) and immediately after exercise (Post; gray). All data are presented as mean ± standard error of the mean. *P < 0.05; ***P < 0.001. gDNA, genomic DNA.

