Figure 1.
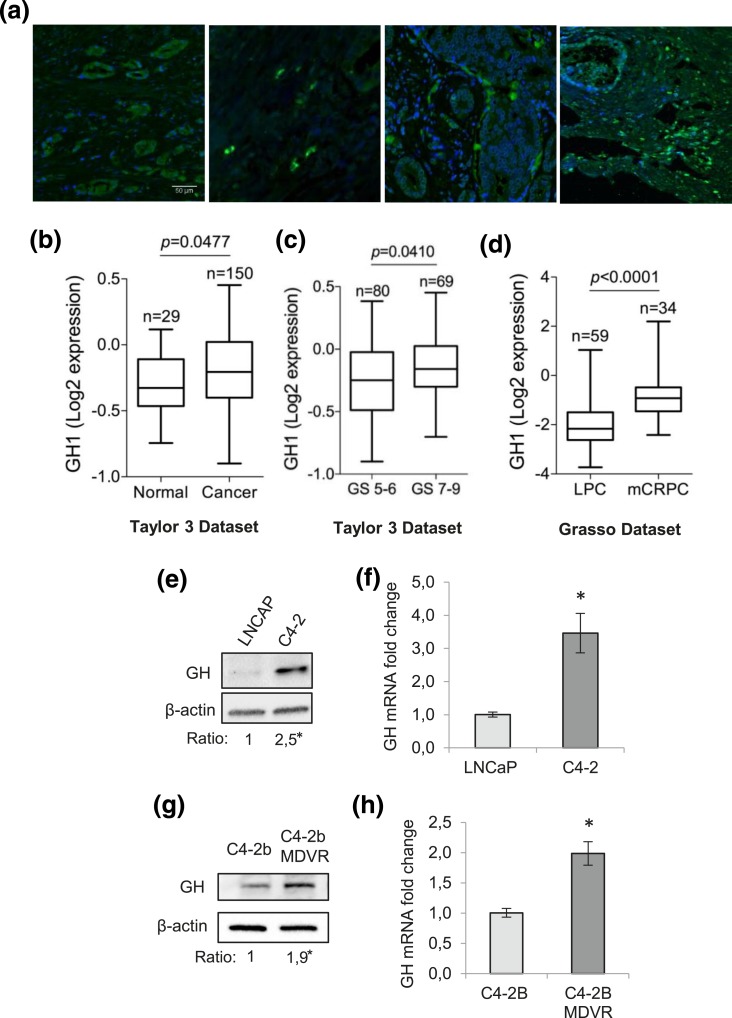
GH expression in human tissue and PCa cell lines. (a) Representative images of GH immunofluorescence staining of human PCa specimens (from left to right: GS 5 tumor; GS 9 tumor; GS 7 tumor and castration resistant PCa) (b–d) Relative GH gene expression in human normal prostate vs PCa; in low GS (GS 5 to 6) vs high GS (GS 7 to 10) tumors; and in localized PCa (LPC) vs metastatic CRPC (mCRPC) obtained from (b, c) Oncomine datasets Taylor 3 and (d) Grasso, respectively. (e) GH protein and (f) mRNA expression levels compared in androgen-dependent LNCaP and isogenic CRPC C4-2 cells. (g) GH protein and (h) mRNA expression levels in C4-2B parental and C4-2B enzalutamide-resistant MDVR cells by Western blot of whole cell lysates and by qPCR after total RNA extraction. β-actin expression was used for normalization. Experiments presented in (d–g) were repeated three times. Differences among groups were compared by two-tailed unpaired Student t test. *P < 0.05.

