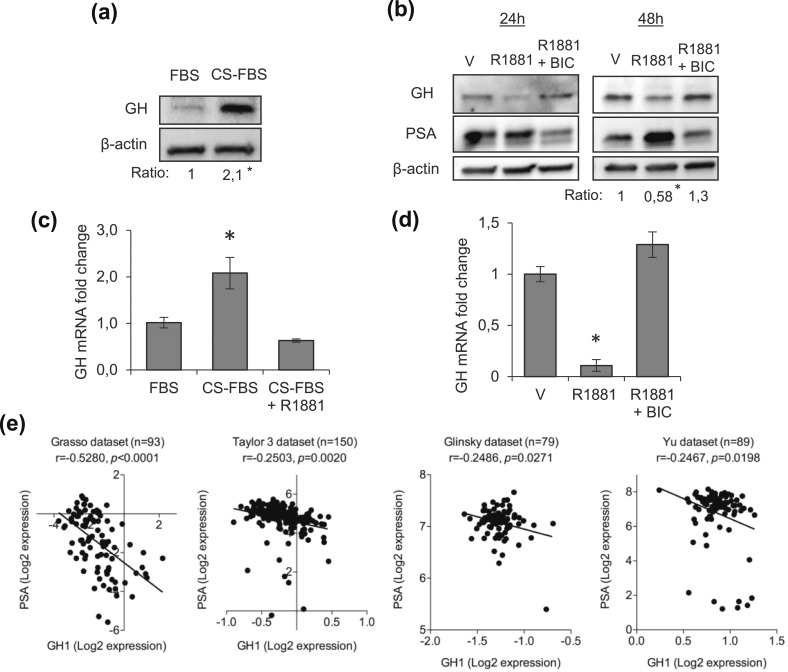
Figure 2.
Androgens negatively regulate GH expression by AR in PCa cells. (a) GH expression was evaluated by Western blot in LNCaP cells growing for 72 hours in RPMI 1640 supplemented with 5% FBS or 5% charcoal-stripped FBS (CS-FBS). Quantification of band intensities is shown below each lane as the GH/actin ratio relative to FBS group (mean of three independent experiments). Differences were compared by two-tailed unpaired Student t test. *P < 0.05. (b) GH mRNA expression was analyzed by qPCR in LNCaP cells grown for 72 hours in RPMI 1640 supplemented with 5% FBS, 5% CS-FBS and CS-FBS + 1 nM R1881. *P < 0.05 (FBS vs CS-FBS, and CS-FBS vs R1881). (c, d) LNCaP cells were grown in RPMI 1640 5% CS-FBS for 24 hours before treatment with 1nM R1881 alone or in combination with the AR antagonist bicalutamide (Bic, 10 µM). PSA expression was used as a marker for drug efficacy, and β-actin as protein-loading control. Experiments in (a–d) were repeated three times. Differences between means were compared by one-way analysis of variance, *P < 0.05. (e) Correlation of GH and PSA gene expression in human PCa datasets downloaded from Oncomine. Four different datasets were analyzed by Pearson correlation test.

