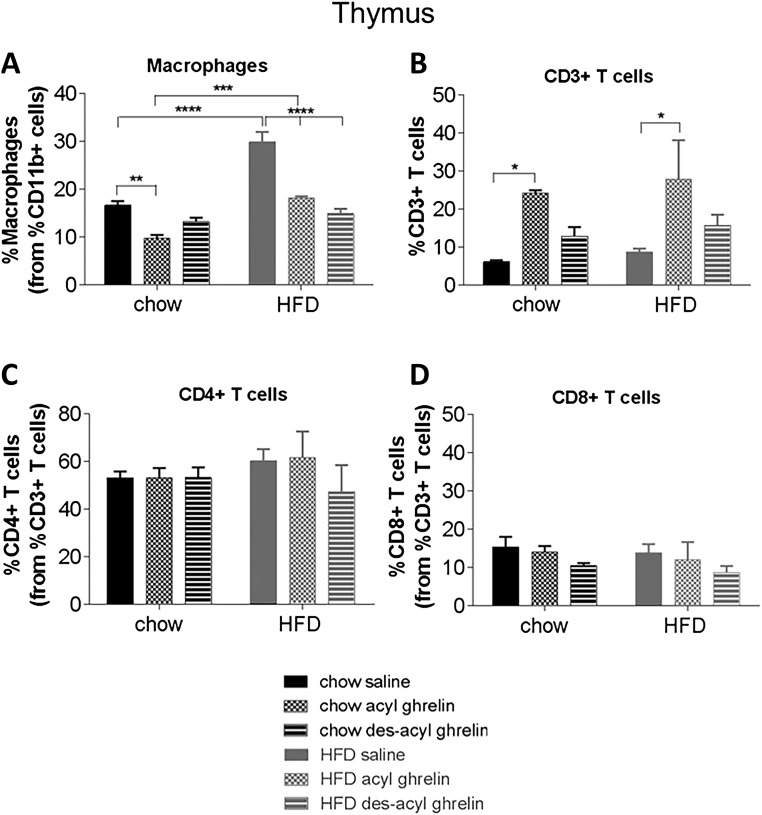
Figure 4.
Immune cell profiles of thymus from C57BL/6 mice treated with saline, acyl, or des-acyl ghrelin and percentage of immune cells and markers from the parent population of leukocytes, (A) macrophages, (B) CD3+ T cells, (C) CD4+ T cells, and (D) CD8+ T cells in the thymus of C57BL/6 mice. Mice received either a chow (n = 15) or HFD (n = 15) and an intraperitoneal injection of either 1mg/kg saline, acyl, or des-acyl ghrelin. Results expressed as mean ± standard error of the mean with P values obtained using a two-way analysis of variance followed by Tukey's post hoc test. *P < 0.05; **P < 0.01; ***P < 0.001; ****P < 0.0001.

