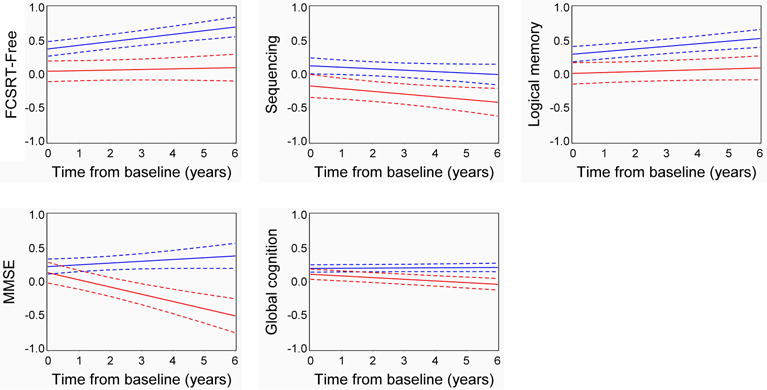
Fig. 2. Estimated longitudinal cognitive performance of individuals with high and low CSF tau/Aβ42.

The trajectories represent two hypothetical individuals, one with low CSF tau/Aβ42 (≤0.46, blue) and one with high CSF tau/Aβ42 (>0.46, red), who were women, APOE ε4 negative, lacked a family history of AD and had a baseline age and education fixed at the sample averages. Dashed lines represent the standard error. Each unit indicates one standard deviation from the mean.
