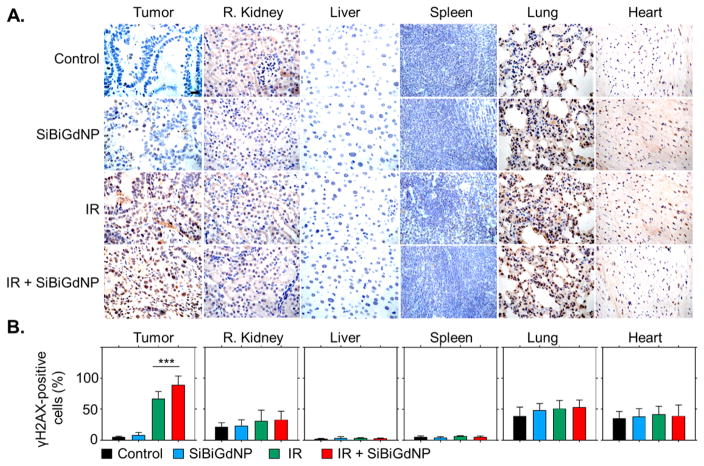
Figure 5.
Radiation-induced DNA damage study. (a) γH2AX staining representing the DNA double-strand breaks in the tumor and healthy organs. Damaged cells are brown and viable cells are blue. Magnification 63×; scale bar = 20 μm. (b) The positive γH2AX cells were quantified across n = 30 images randomly chosen (n = 3 per group). Data are shown as mean ± STD. Triple asterisks indicate P < 0.001.

