
Figure 2.
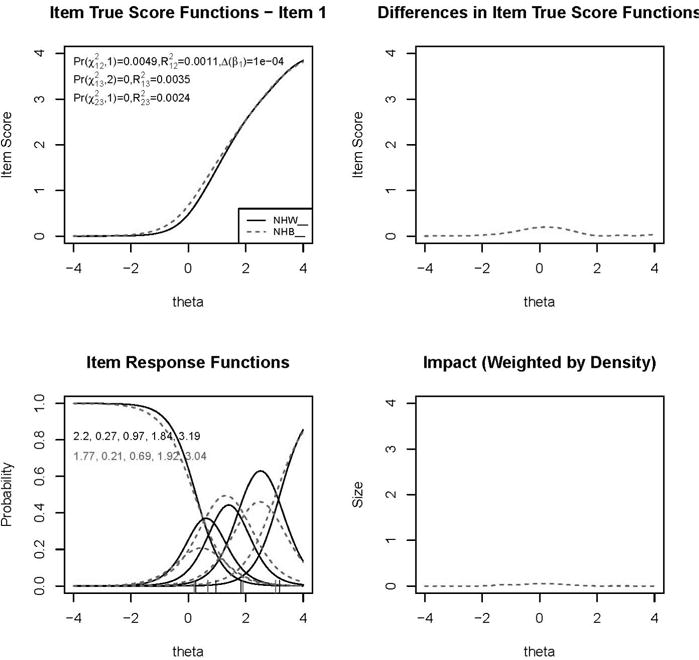
Example graphics depicting magnitude of differential item functioning (from lordif) comparing non-Hispanic Blacks (NHB) and non-Hispanic Whites (NHW)
Expected item scores; category response functions; differences in expected scores and density weighted differences.
(The latter are similar to Wainer’s (1993) magnitude measures and are unsigned differences weighted by the theta distributions of the focal group) (lordif depression NHB vs NHW)