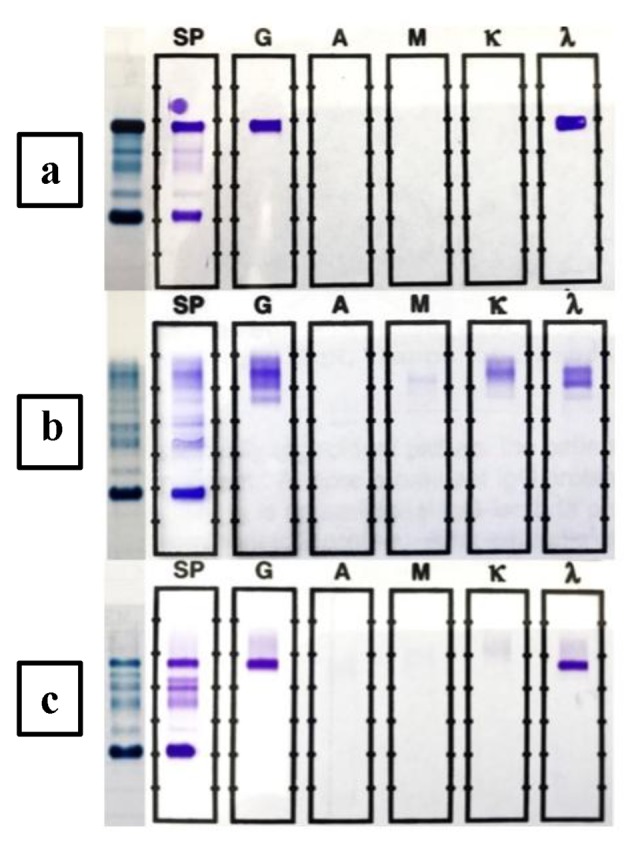
Figure 2.

Time course of oligoclonal patterns in a selected patient. The SPEP patterns are shown in the left lane in all of the three SPEP/SIFE records shown. The top SPEP/SIFE (a) was done in February 2010 and displayed a monoclonal IgG lambda band in the anodal gamma region. When the protein was present in high concentration (4.13 g/dL), as was the case at this time, the band overlapped the C3 band. The κ/λ ratio was appropriately lambda dominant at 0.0001. The middle SPEP/SIFE (b) was done in November 2010, 2 months after ASCT. The original malignant IgG lambda band is detectable in the anodal gamma region. One prominent IgG kappa, an additional fainter IgG kappa band, cathodal to the more prominent one, and two lambda light chain bands are readily detectable, cathodal to the malignant band. Despite the presence of original monoclonal IgG lambda and two oligoclonal lambda bands, the κ/λ ratio was kappa dominant at 18.9. The κ/λ ratio remained normal/neutral for the next 28 months, despite the recurrence of the malignant IgG lambda. The κ/λ ratio became lambda dominant when the concentration of the recurrent malignant IgG lambda monoclonal protein reached 1.67 g/dL. The lower SPEP/SIFE (c) was done in September 2016 and by then all of the oligoclonal bands had disappeared and the malignant IgG lambda band was present at a concentration of 2.62 g/dL. While it entails the benefit of retrospective review, the two lambda light chain bands depicted in the middle figure did not represent light chain escape in a treated patient but were part of an oligoclonal response.
