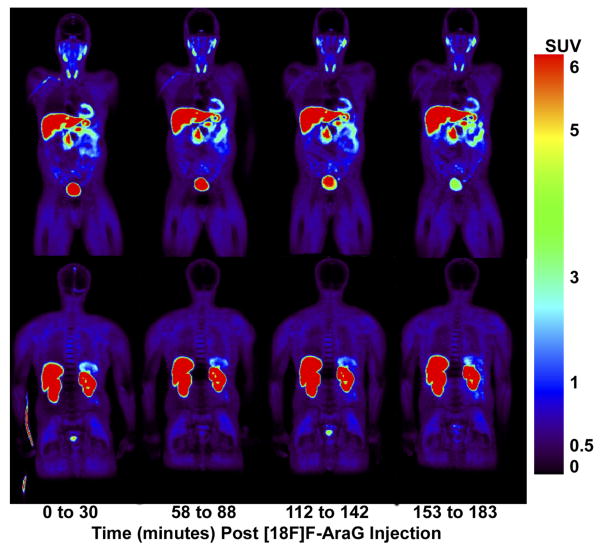
Figure 4. Whole body PET images of [18F]F-AraG in a healthy human volunteer.
Frontal (top panel) and dorsal (bottom panel) coronal PET images taken immediately after intra-venous injection of the tracer and at serial time points in one of the 6 humans imaged. Highest activity is observed in the liver, kidneys and bladder, associated with [18F]F-AraG clearance from the body. Uptake is also observed in the heart and spleen while relatively low background activity is observed in all other tissues. Similar images were obtained from the other 5 subjects.

