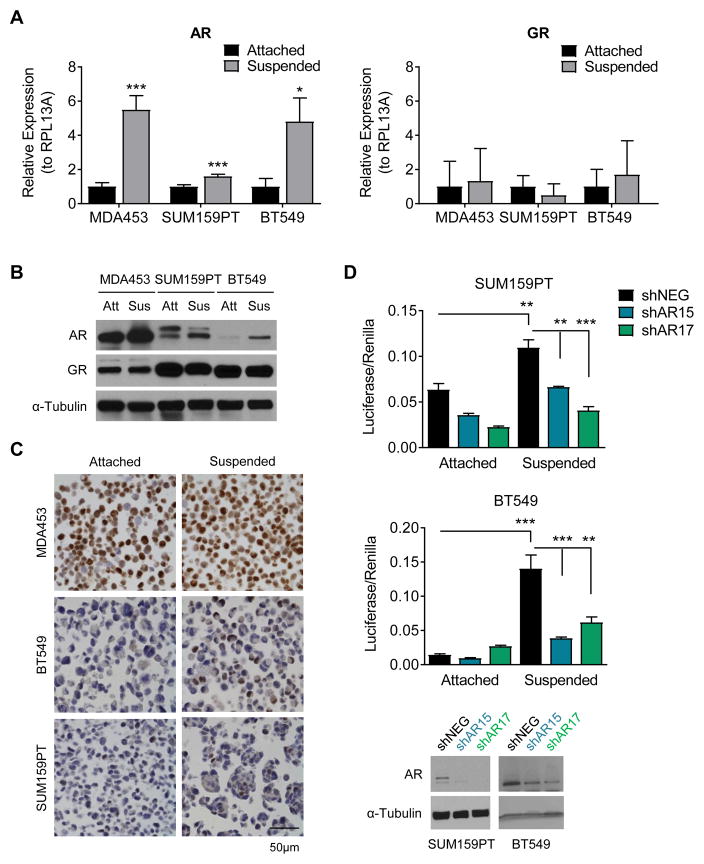
Figure 2.
AR expression increases in forced suspension culture. A, Quantitative real-time PCR (qRT-PCR) for androgen receptor (AR) and glucocorticoid receptor (GR) gene expression in attached versus forced suspension culture conditions at 24 hours. B, Western blot for AR and GR in attached versus forced suspension culture conditions at 24 hours. α-Tubulin was used as a loading control. C, Immunohistochemistry for AR in attached versus forced suspension culture conditions at 48 hours. Representative images, magnification 400X. D, AR luciferase reporter assay in attached compared to suspended conditions in cells transduced with a non-targeting control (shNEG) or shRNAs targeting AR (shAR15, shAR17). Western blot for AR. α-Tubulin was used as a loading control. Mean ± SD; * p < 0.05, ** p < 0.01, *** p < 0.001.

