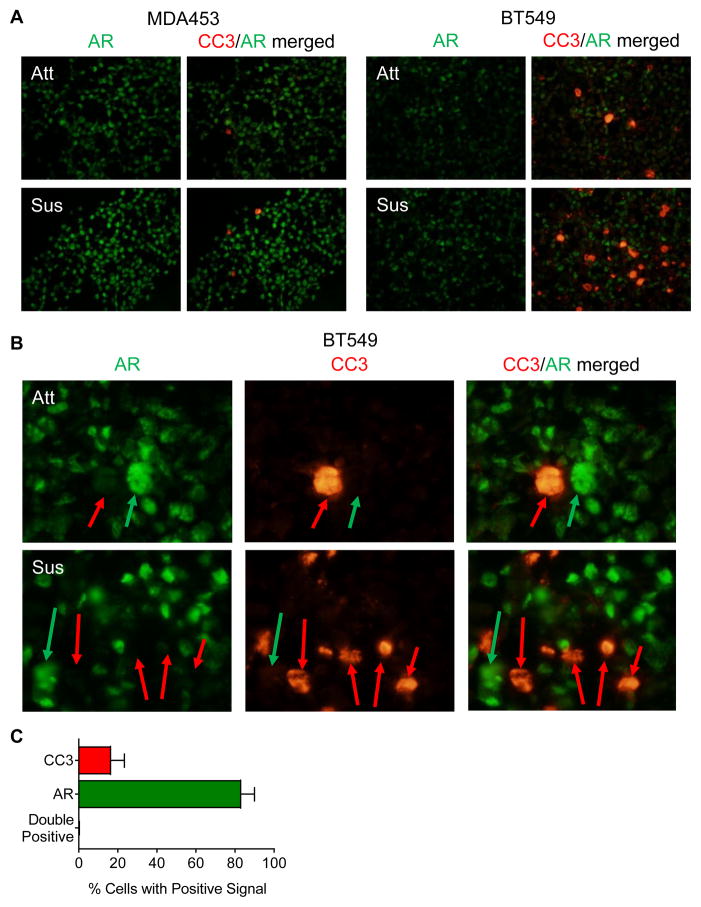
Figure 3.
AR and cleaved-caspase 3 (CC3) increase in TNBC cells cultured in forced suspension and do not co-localize. A–B, TNBC cells were grown in attached and suspended conditions for 48 hours and stained for AR (green) and CC3 (red) using tyramide signal amplification. Representative images; A, magnification 400X, B, magnification 1000X to emphasize CC3 (red arrows) and AR (green arrows) localization. C, image analysis of BT549 suspended cells using inForm 2.2. Percentage of cells positive for Cy3.5 (CC3), FITC (AR), or double positive (CC3+AR) were calculated from the total number of positive cells for n = 3 random 200X fields; mean ± SEM.

