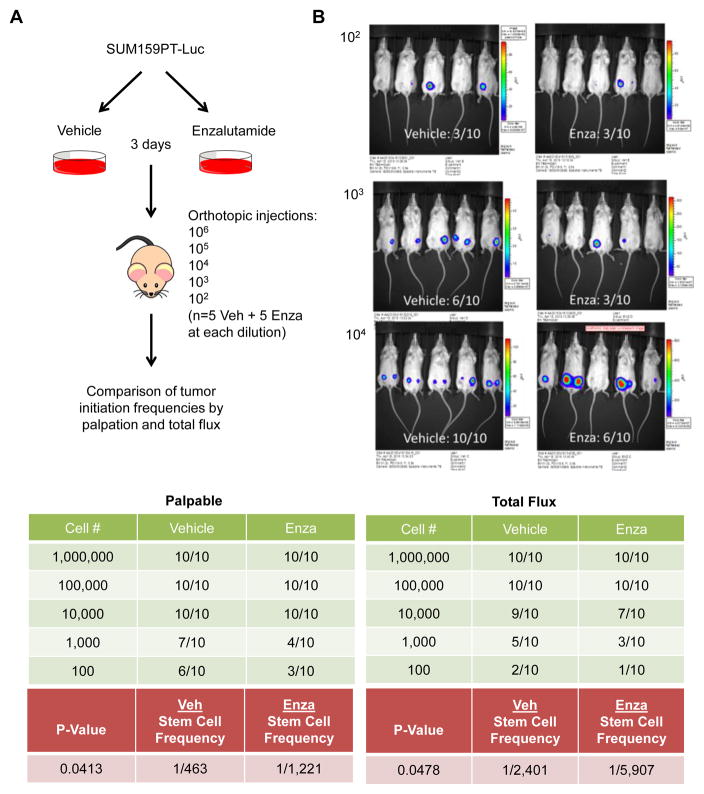
Figure 6.
Tumor initiation frequency of SUM159PT cells pre-treated with enzalutamide. A, schematic of experimental design. B, Tumor initiation frequency. Top, luciferase activity, measured as total flux, in mice injected with 102–104 cells pre-treated for 3 days with vehicle control (Veh) or enzalutamide (Enza). Bottom, summary of the number of mice per group with tumors as determined by palpation (left) and luciferase activity/total flux (right).

