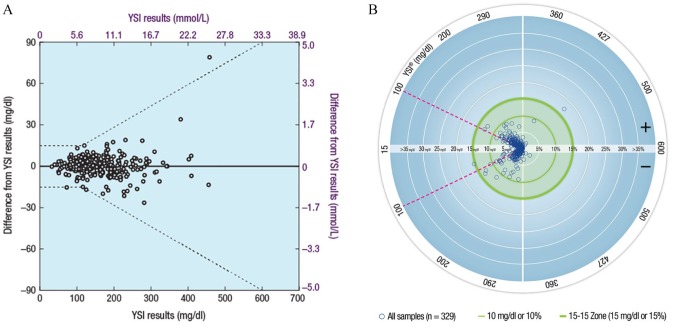
Figure 2.
Graphical representations of BGMS results from the clinical study in subjects with diabetes (ISO 15197:2013 Section 8). (A) Differences of subject-obtained capillary fingertip results from YSI reference results.a (B) Radar plot of subject-obtained capillary fingertip results compared with YSI reference results.b
BGMS, blood glucose monitoring system; ISO, International Organization for Standardization; YSI, YSI analyzer.
aDashed lines represent ISO 15197:2013 Section 8 accuracy criteria.
bSingle points are representations of an error in units of mg/dl for YSI blood glucose values <100 mg/dl (<5.6 mmol/L; region of the plot within the magenta dashed lines) and in units of percentage for YSI blood glucose values ≥100 mg/dl (≥5.6 mmol/L; region of the plot outside the magenta dashed lines).

