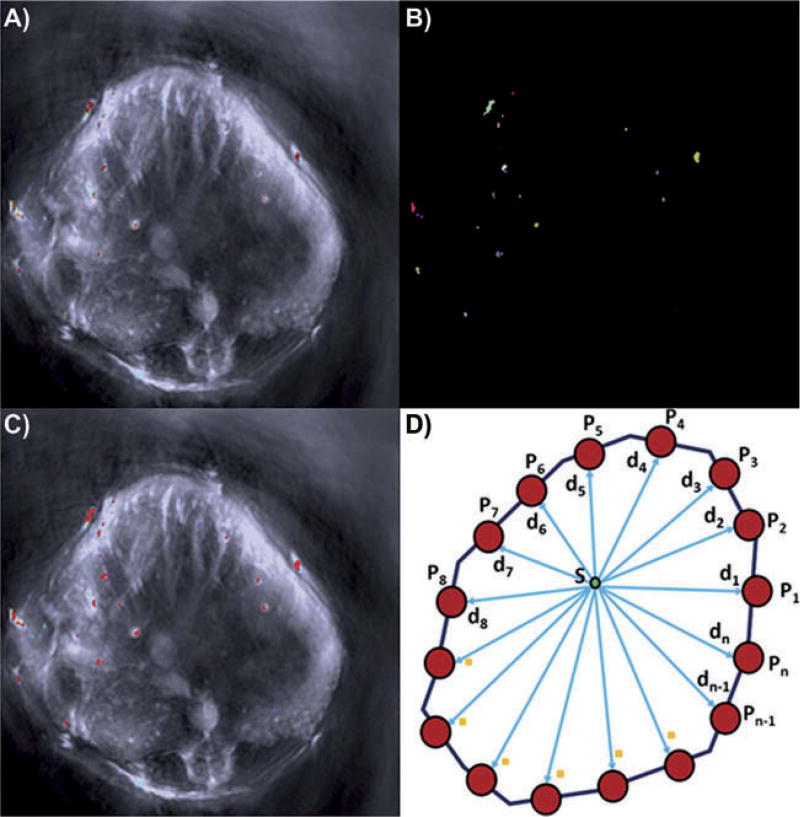
Fig. 5.
Illustration of our quantitative results. A) typical MSOT image. B) Region of microspheres detected. C) region of microspheres detected superimposed on the original MSOT images. D) Illustration of distance map calculation. Note that we used the region growing algorithm to detect each microsphere in which each area containing IR-780 dye is represented by a different color to measure its radius. In (C), each region is given a uniform red color to permit measurement using the region growing algorithm.

