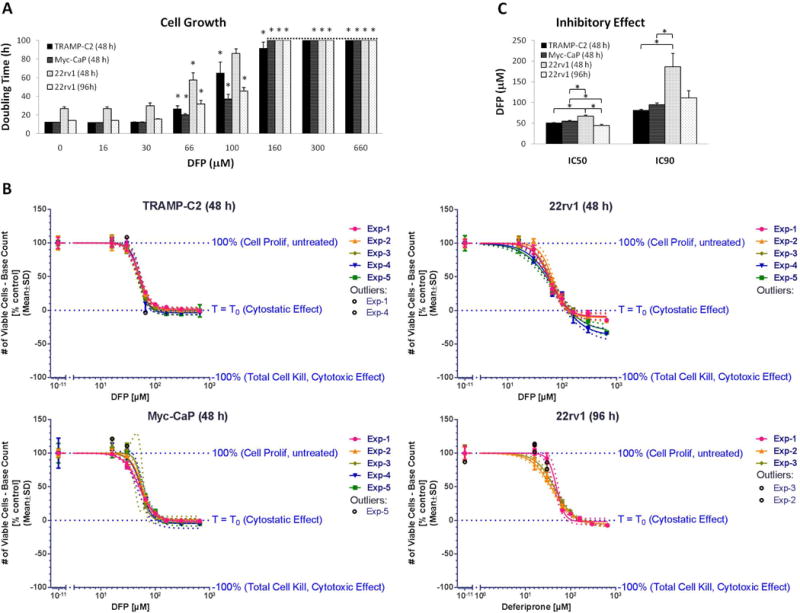
Figure 1.

Inhibition of prostate cancer cell proliferation after incubation with different concentrations of DFP. TRAMP-C2, Myc-CaP and 22rv1 cells were exposed to DFP for 48 h; 22rv1 cells were additionally exposed for 96 h because of their longer doubling times. A, Doubling times based on the number of viable cells at the time of medium change (base count, average ± SD): 48 h TRAMP-C2 group, (4.5±1.4) ×104; 48 h Myc-CaP group, (7.4±1.0) ×104; 48 h 22rv1 group, (4.8±0.8) ×104; 96 h 22rv1 group, (4.6±0.5) ×104. * mark significant differences in cell doubling time compared to untreated control cells for each cell line. B, Normalized log-lin curves (n=5 for 48 h exposure and n = 3 for 96 h exposure of 22Rv1) for each cell line, indicating the thresholds for untreated (Top), cytostatic effect (Bottom), and cytotoxic effect (inferior limit). Markers depict the experimental data, overlaid with the curve fit (solid line) and the 95% confidence bands (dotted lines). For each independent experiment, data were averaged from triplicate wells for each condition. C, IC50 and IC90 average values determined for each cell line and incubation time, from the respective log-lin curves, depicted in B.
