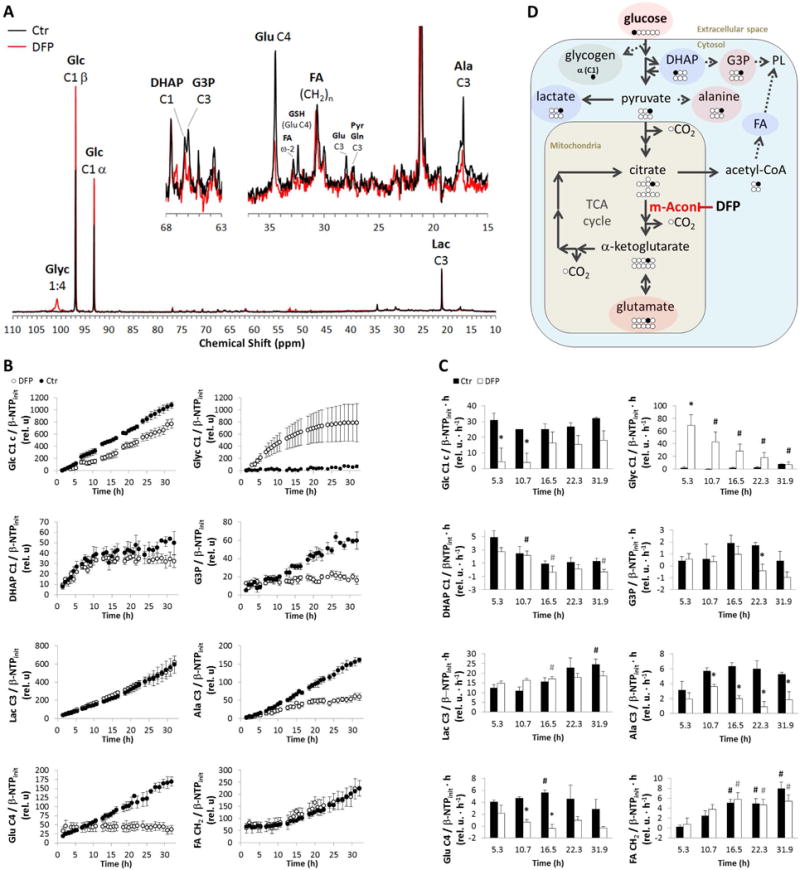
Figure 4.

Time-course effect of DFP (100 μM) on live TRAMP-C2 cell metabolism during perfusion experiments, as detected by 13C MRS. Position of carbon labeled by 13C from 1-13C-labeled glucose (Glc C1) depicted by number following C. A, Representative 13C-MR spectral profiles after 24 h of experiment time for untreated control (Ctr, black) and DFP-treated (DFP, red) TRAMP-C2 cells – major peak assignments displayed: glycogen (Glyc); glucose (Glc); dihydroxyacetone phosphate (DHAP); glycerol-3-phosphate (G3P); glutamate (Glu); fatty acids (FA); glutathione (GSH); pyruvate (Pyr), glutamine (Gln); alanine (Ala); and lactate (Lac). B, Average time course of 1-13C-Glc consumption and synthesis of 1-13C-Glyc, 1-13C-DHAP, 3-13C-G3P, 3-13C-Lac, 3-13C-Ala, 4-13C-Glu, and (CH2)-13C-FA, normalized to initial value of β-NTP (β-NTPinit). C, Average metabolite synthesis (consumption) rates at different time intervals. D, Biochemical model illustrating the inhibitory effect of DFP on m-Acon and the major metabolic changes detected in response to DFP exposure: increase (green); decrease (red); no change (blue). PL, phospholipids. # (black for Ctr and grey for DFP-treated cells), significantly different compared to the initial level, for each cell line (paired t-Test); * significantly different values between Ctr and DFP-treated cells at the same time point (unpaired t-Test).
