Figure 1.

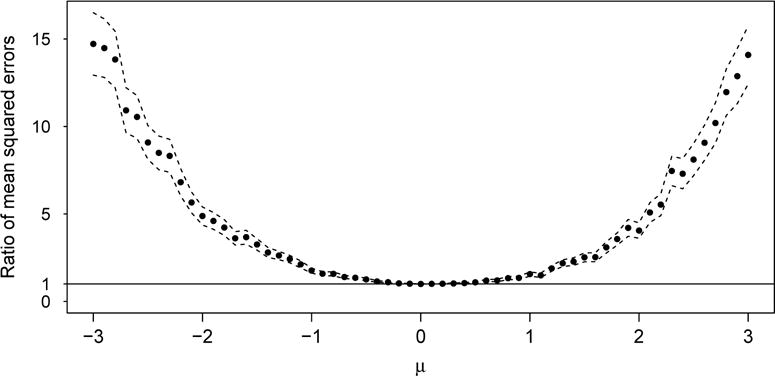
Estimated relative efficiency of vs. , together with 95% confidence bands. As μ moves away from 0, the mixing rate of chain 2 slows, and the efficiency of vs. increases. The horizontal line at height 1 serves a reference line.

Estimated relative efficiency of vs. , together with 95% confidence bands. As μ moves away from 0, the mixing rate of chain 2 slows, and the efficiency of vs. increases. The horizontal line at height 1 serves a reference line.