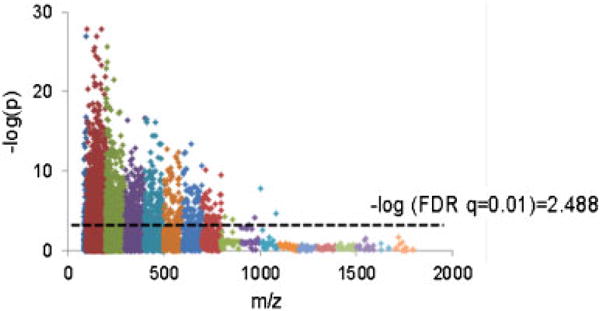
Figure 1. Manhattan plot on 7608 features from C18 showed that 2302 features were significantly different at FDR q = 0.01.

X-axis is m/z ranging 85–2000. Y-axis shows −log p-value for each metabolite detected between the two conditions. The higher the y-axis value, the more significant the difference was between bile positive and negative samples. Dot line is −log of FDR 0.01. FDR, false discovery rate; m/z, mass to charge ratio.
