
Figure 3. Principal component regression analysis (PCRA) on 2411 features which appears in all runs of all samples.
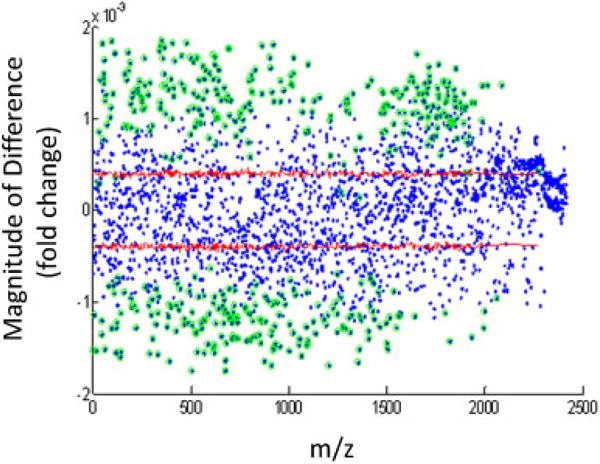
Four hundred sixty-one features were significantly related to bile acids. Green circles represent significant variables by the permutation and Bonferroni testing of PCRA loadings (regression vector). The red line represents two-sided 95% confidence intervals of the variables coefficient (i.e. effect) by permutation tests. The magnitude of the value on the y-axis represents the fold difference between bile positive samples compared with bile negative samples. Metabolites with a positive value were increased with BAA, while metabolites with a negative value were decreased with BAA. BAA, bile acid aspiration.