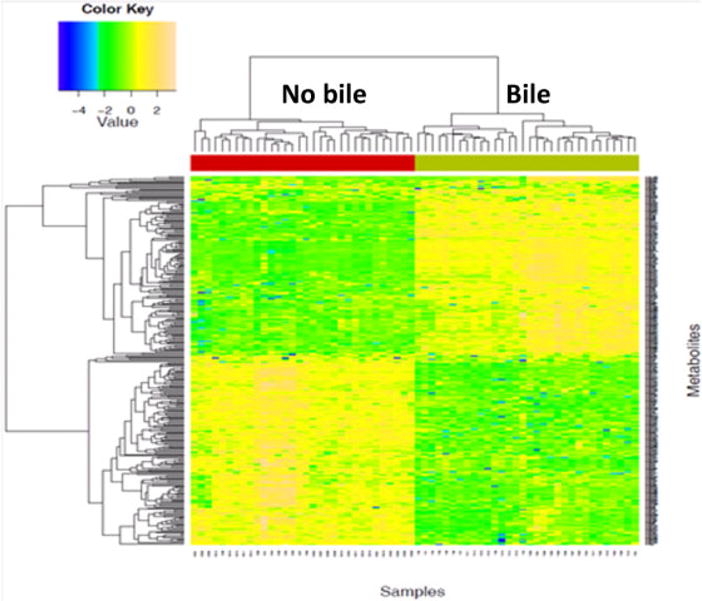
Figure 5. Heatmap of hierarchical clustering on common metabolites (filtered by false discovery rate, PCLS and PCRA Bonferroni and permutation on 58 samples on duplicated runs.

Green bar represents bile presence, and red bar signifies the absence of bile. Each column represents a single patient. PCLS, principal component loading statistics; PCRA, principal component regression analysis.
