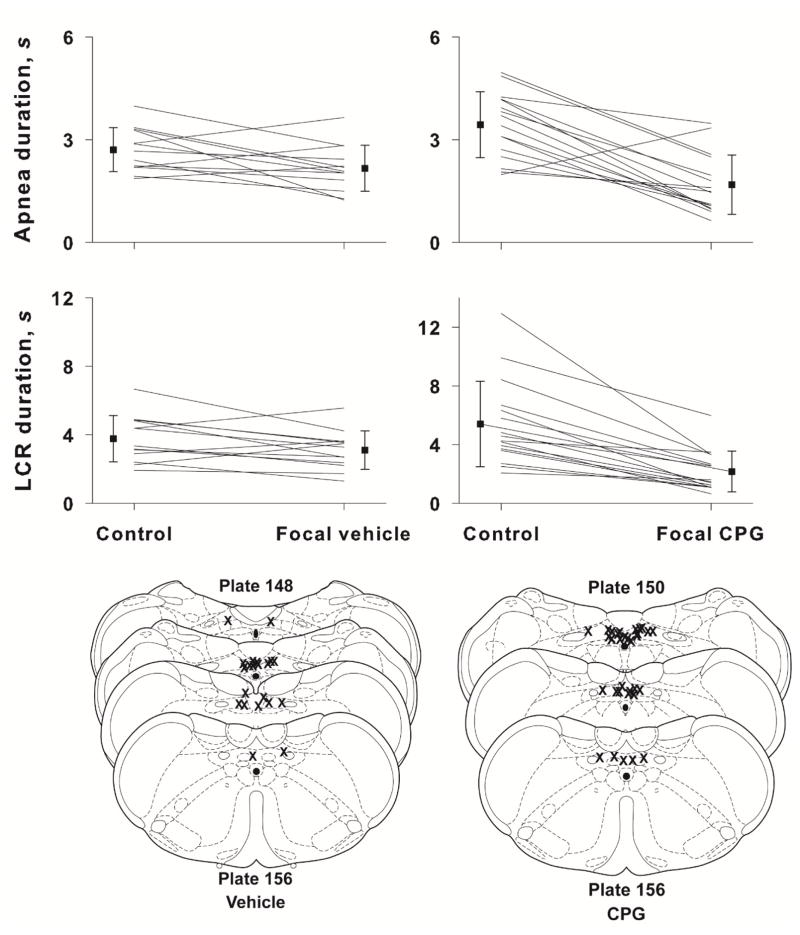
Fig. 6.
The mean and SEM of apnea and LCR durations along with individual animal responses are shown before (control) and after focal injection of either vehicle or CPG into the NTS. Statistical comparisons were made between the control and treated condition within each drug or vehicle treat group. N.S. = not significant; * indicates P < 0.001 for both within and between treatment group comparisons; ** indicates P < 0.001 for both within and between treatment group comparisons. Schematic diagrams of cross-sections of the brainstem show the approximate locations of focal injections of vehicle (left side, lower panel) and CPG (right side, lower panel). Focal microinjections were made bilaterally, so there are two ‘Xs’ for each microinjection, but they may not have been made in the same rostro-caudal location on both sides, and in some cases, we could identify only one injection site.

